
Enterprise UX · Product Redesign
Redesigning a low-code data intelligence platform
Turning an unusable, graph-heavy enterprise data tool into a structured workspace for data discovery, CRUD, governance, and contextual observability.
Skip to the work →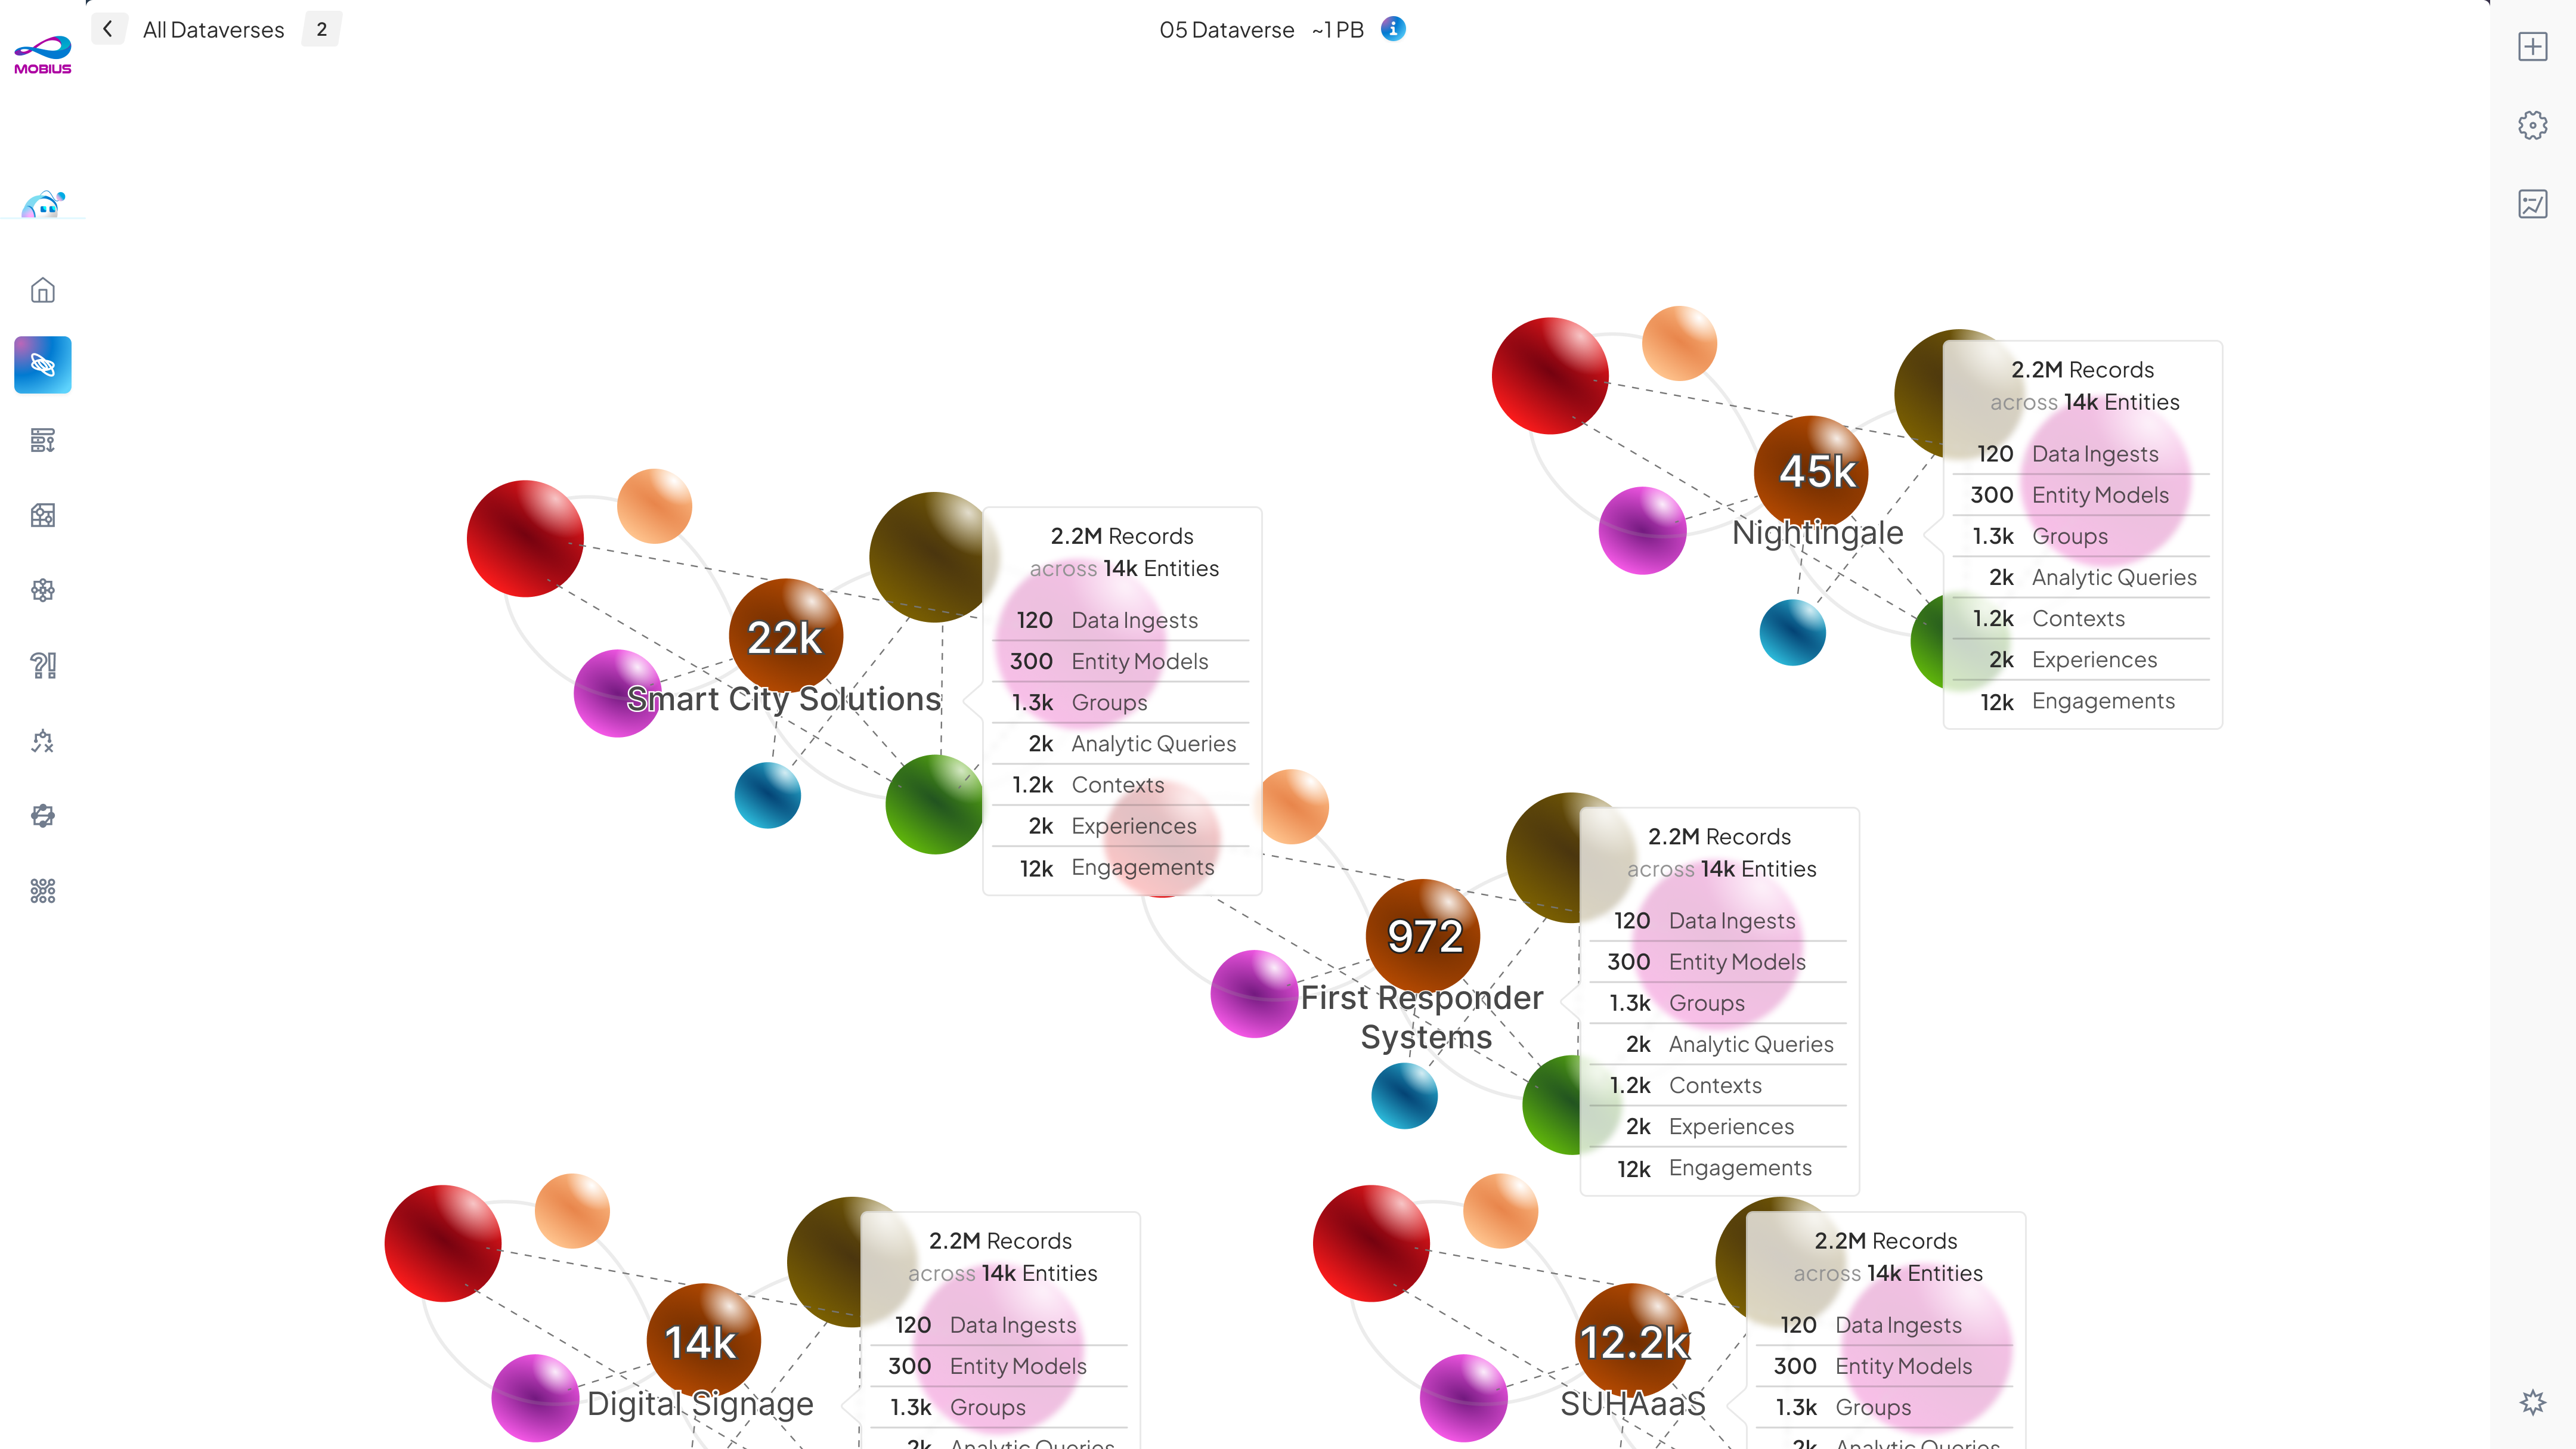
An enterprise data intelligence platform, redesigned from an unusable, graph-heavy tool into a structured low-code workspace for data discovery, CRUD, governance, and observability.
It helped internal teams bring fragmented enterprise data into a shared layer, define data universes and entity models, create business contexts, build target groups, visualize relationships, and trigger data-driven engagements. The capability was strong. The experience was almost unusable. I worked as one of two designers turning it into a workspace that low-code developers and business users could operate.
Solving a complex data tool through structured product design.
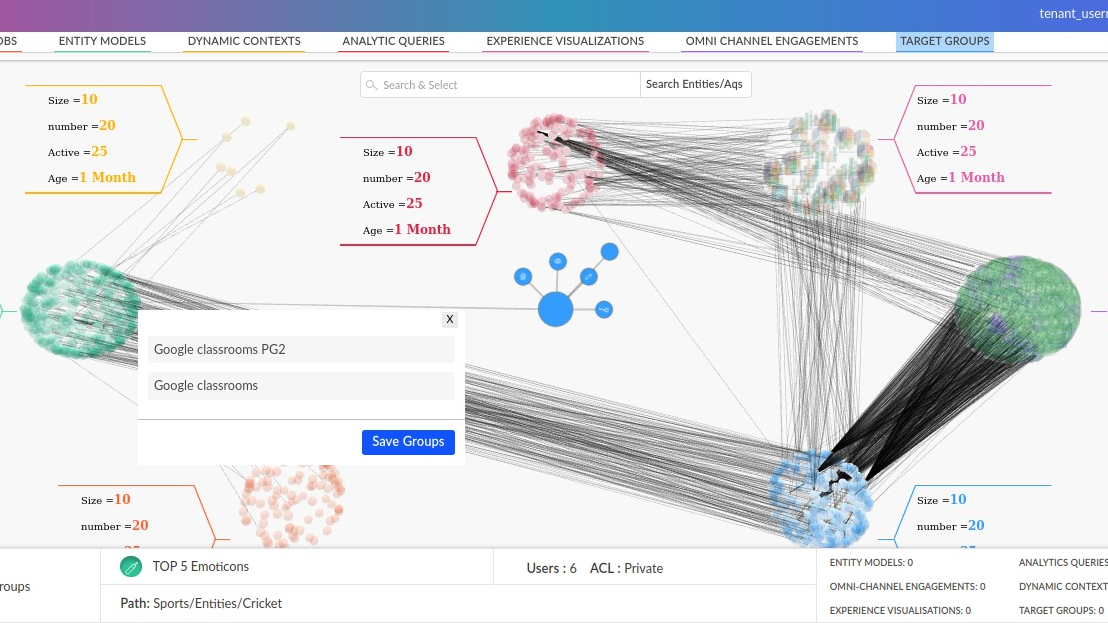
The old experience exposed the underlying data model almost directly. Interactions centred on dense graph clusters, floating pop-ups, and scattered controls, which slowed decisions and fragmented pipeline management.
Metadata repeated across the interface and calls to action were unclear. Users had no consistent way to create, inspect, edit, or govern data constructs, with no reliable sense of where they were in the data universe.
A single workspace that consolidates discovery, modelling, context, and action, with a predictable operating model: browse, select, inspect, act, and govern.
The old tool
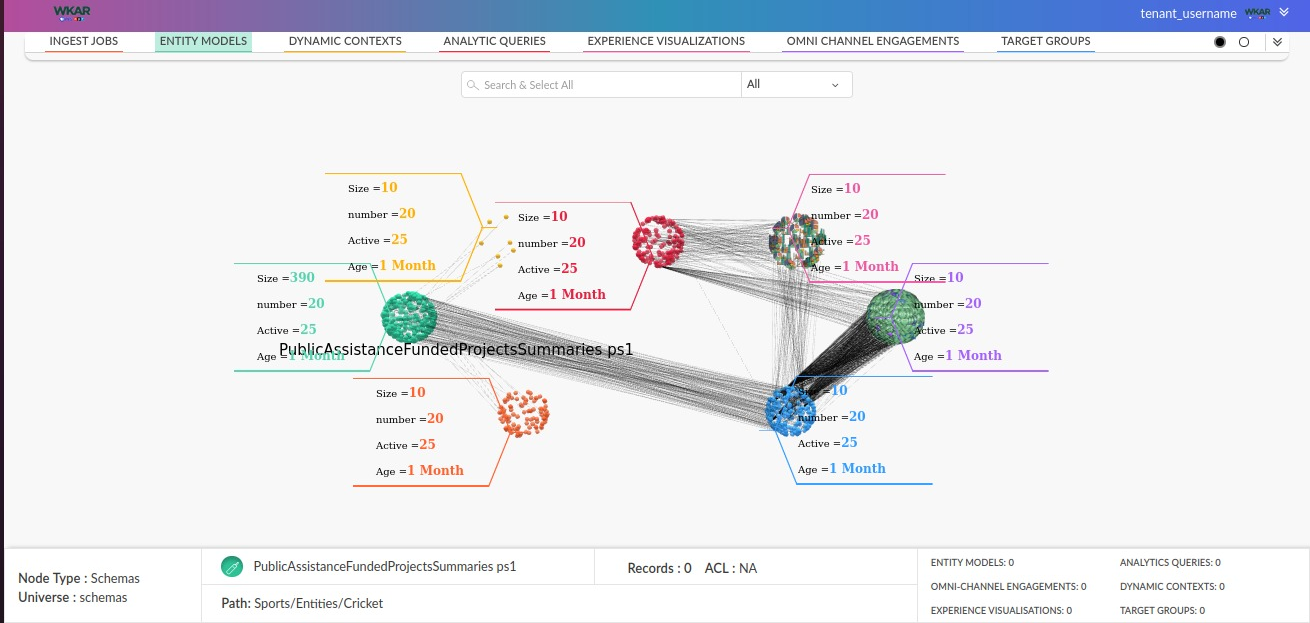
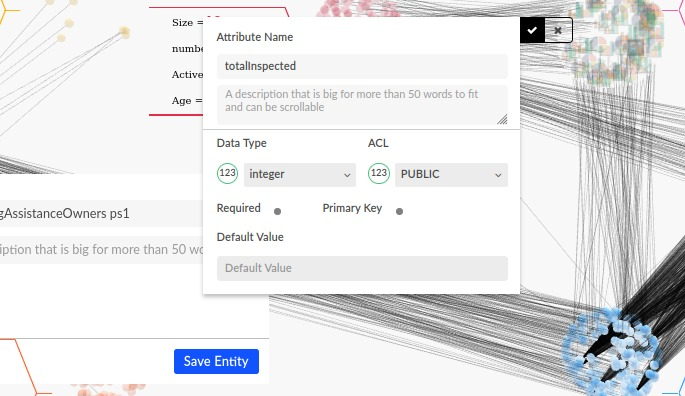
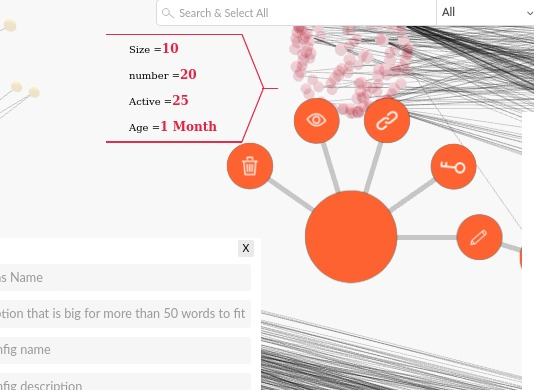
The earlier interface leaned on dense graph clusters, floating pop-ups, and scattered controls. Browser chrome and internal URLs are cropped from these before-state captures.
From scattered controls to a consistent workspace model.
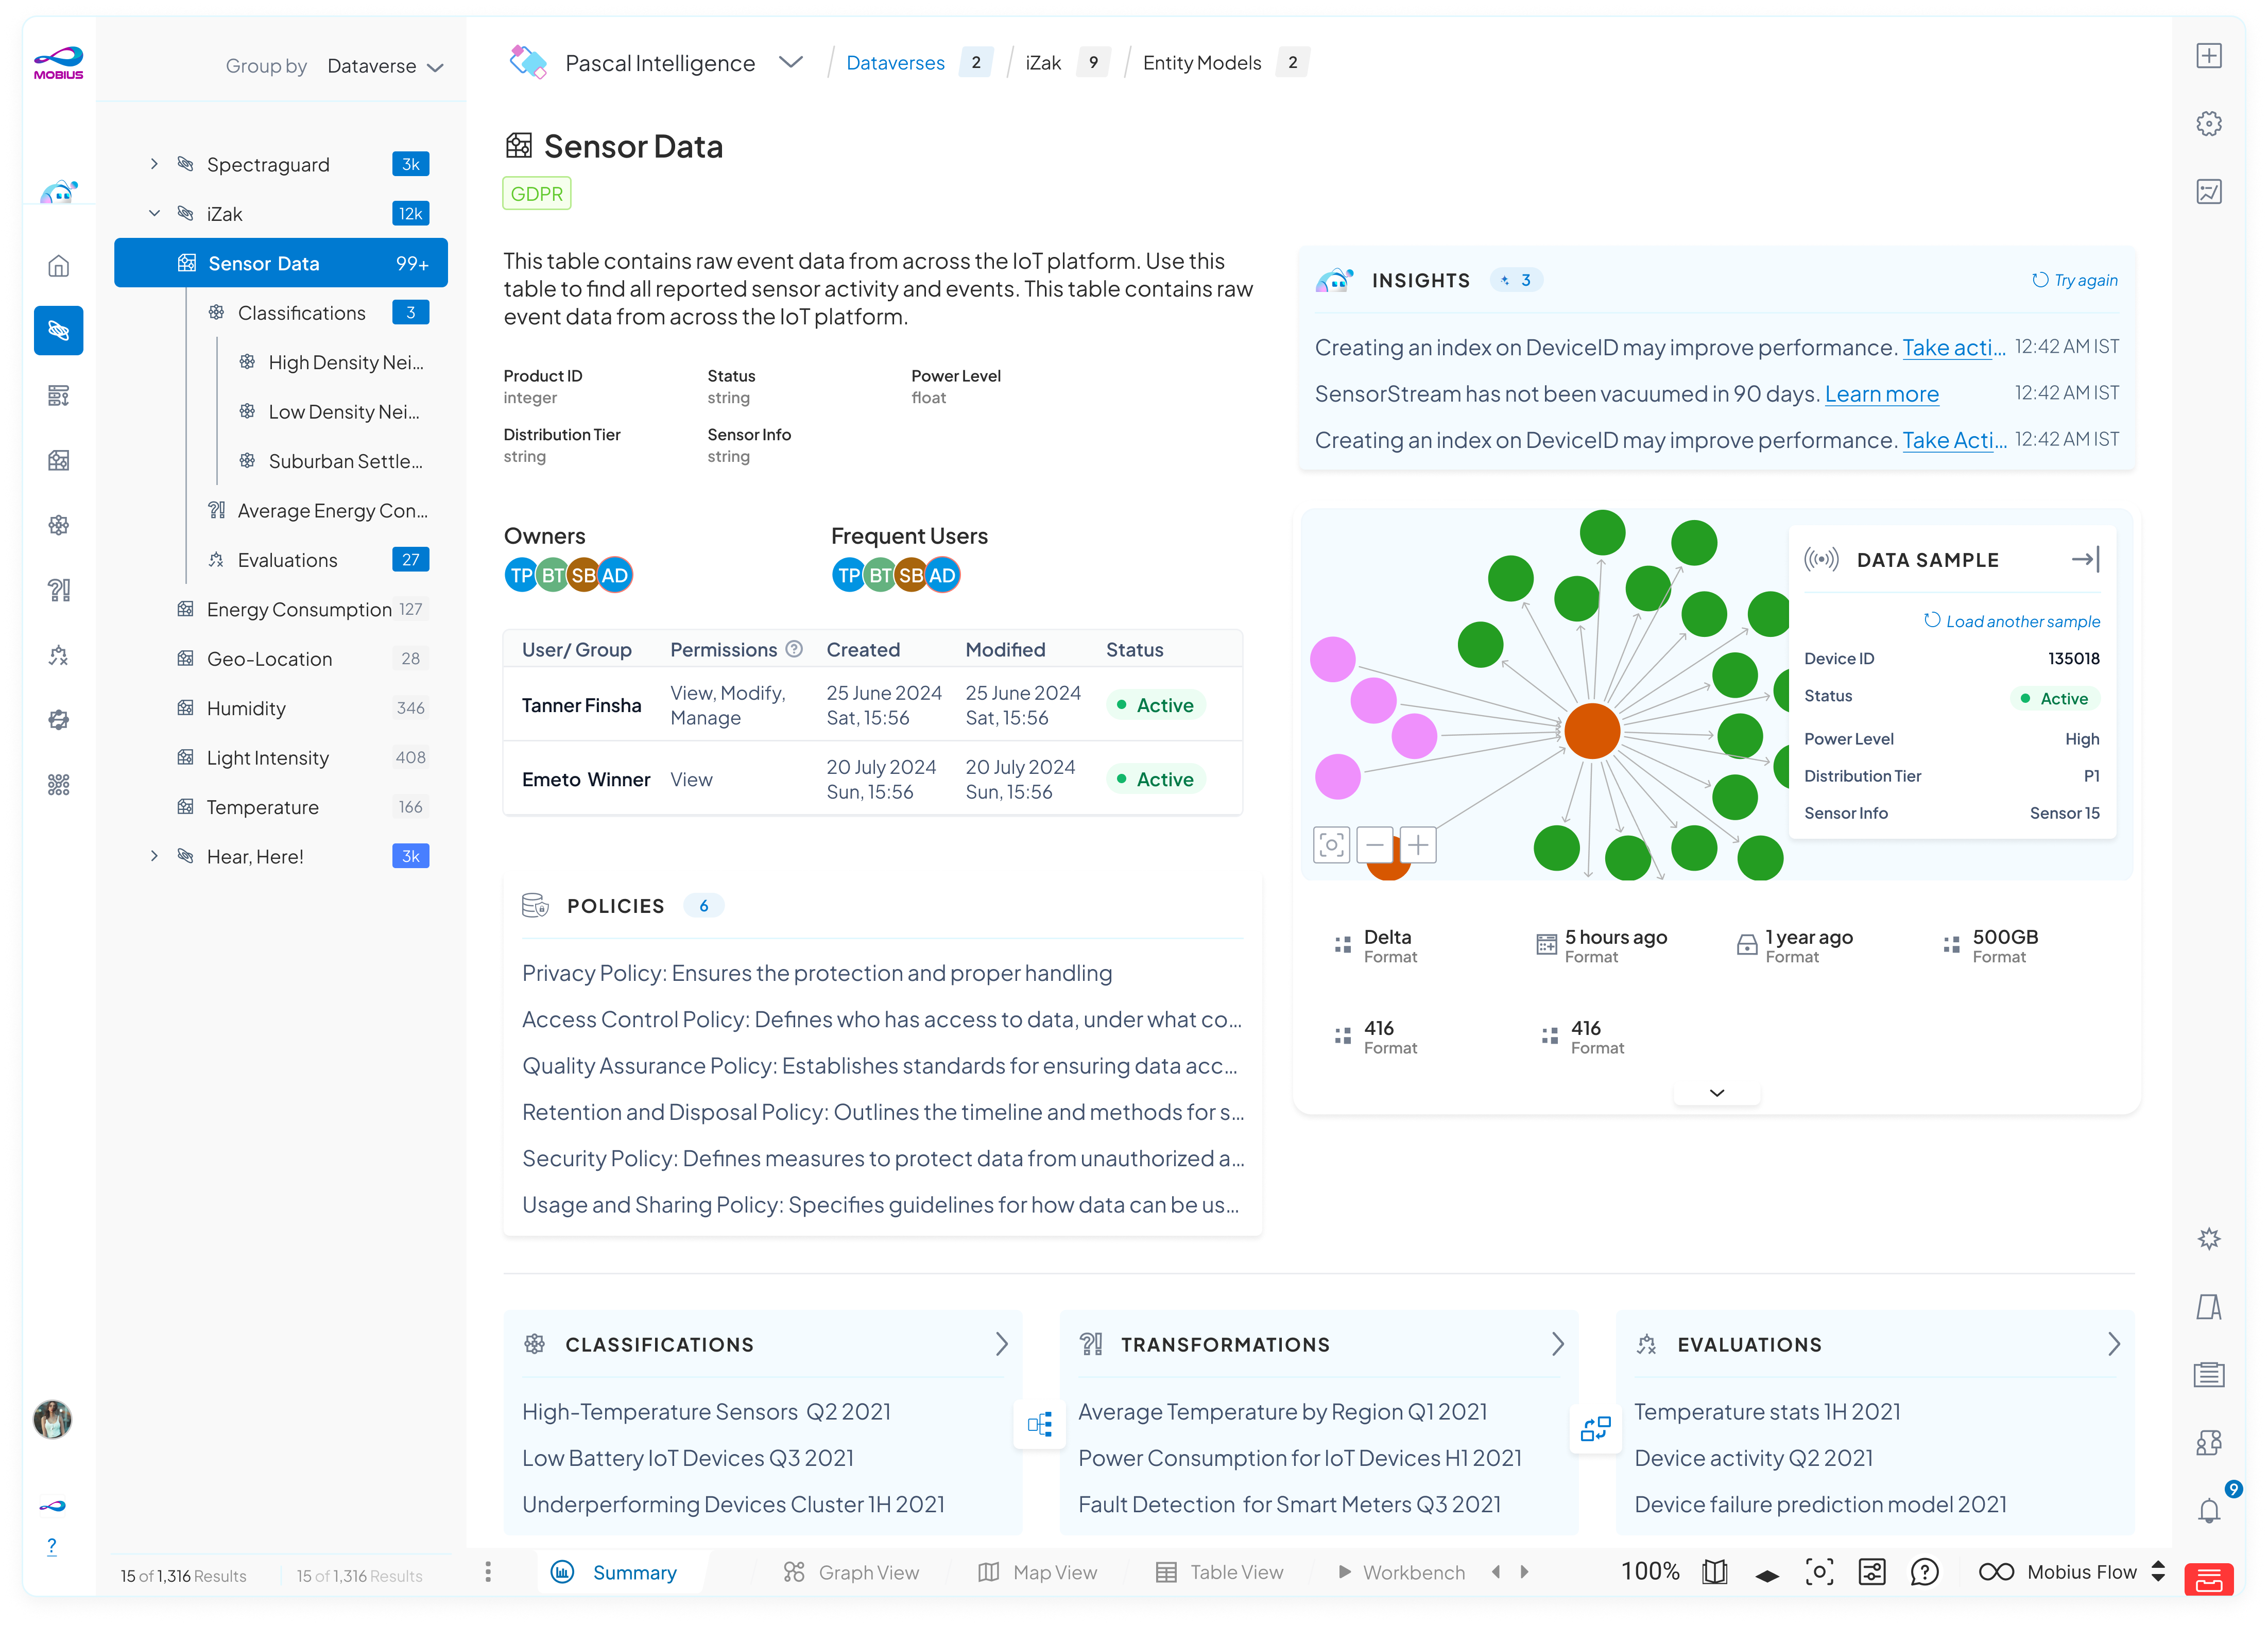
Navigation, object context, actions, and utilities were separated into predictable regions: a persistent left hierarchy, a central work area for the selected object, a contextual right panel for creation, object-level tabs, and a bottom switcher across summary, graph, map, table, and workbench views.
Insight → design decision
The card sort put management, governance, and security into the same core, and the operating model put a role at every step.
So the workspace separated navigation, object context, actions, and utilities into fixed regions, with the object as the constant across all of them.
 0102030405
The workspace let users read the product at three levels: the data universe they were in, the construct they worked on, and the specific object or schema they inspected.
A workspace that turns dense data relationships into a clear, inspectable journey across graph, map, table, and schema.
Decision · Graph-first or workspace-first
The old tool was graph-first, and its heaviest users navigated by graph.
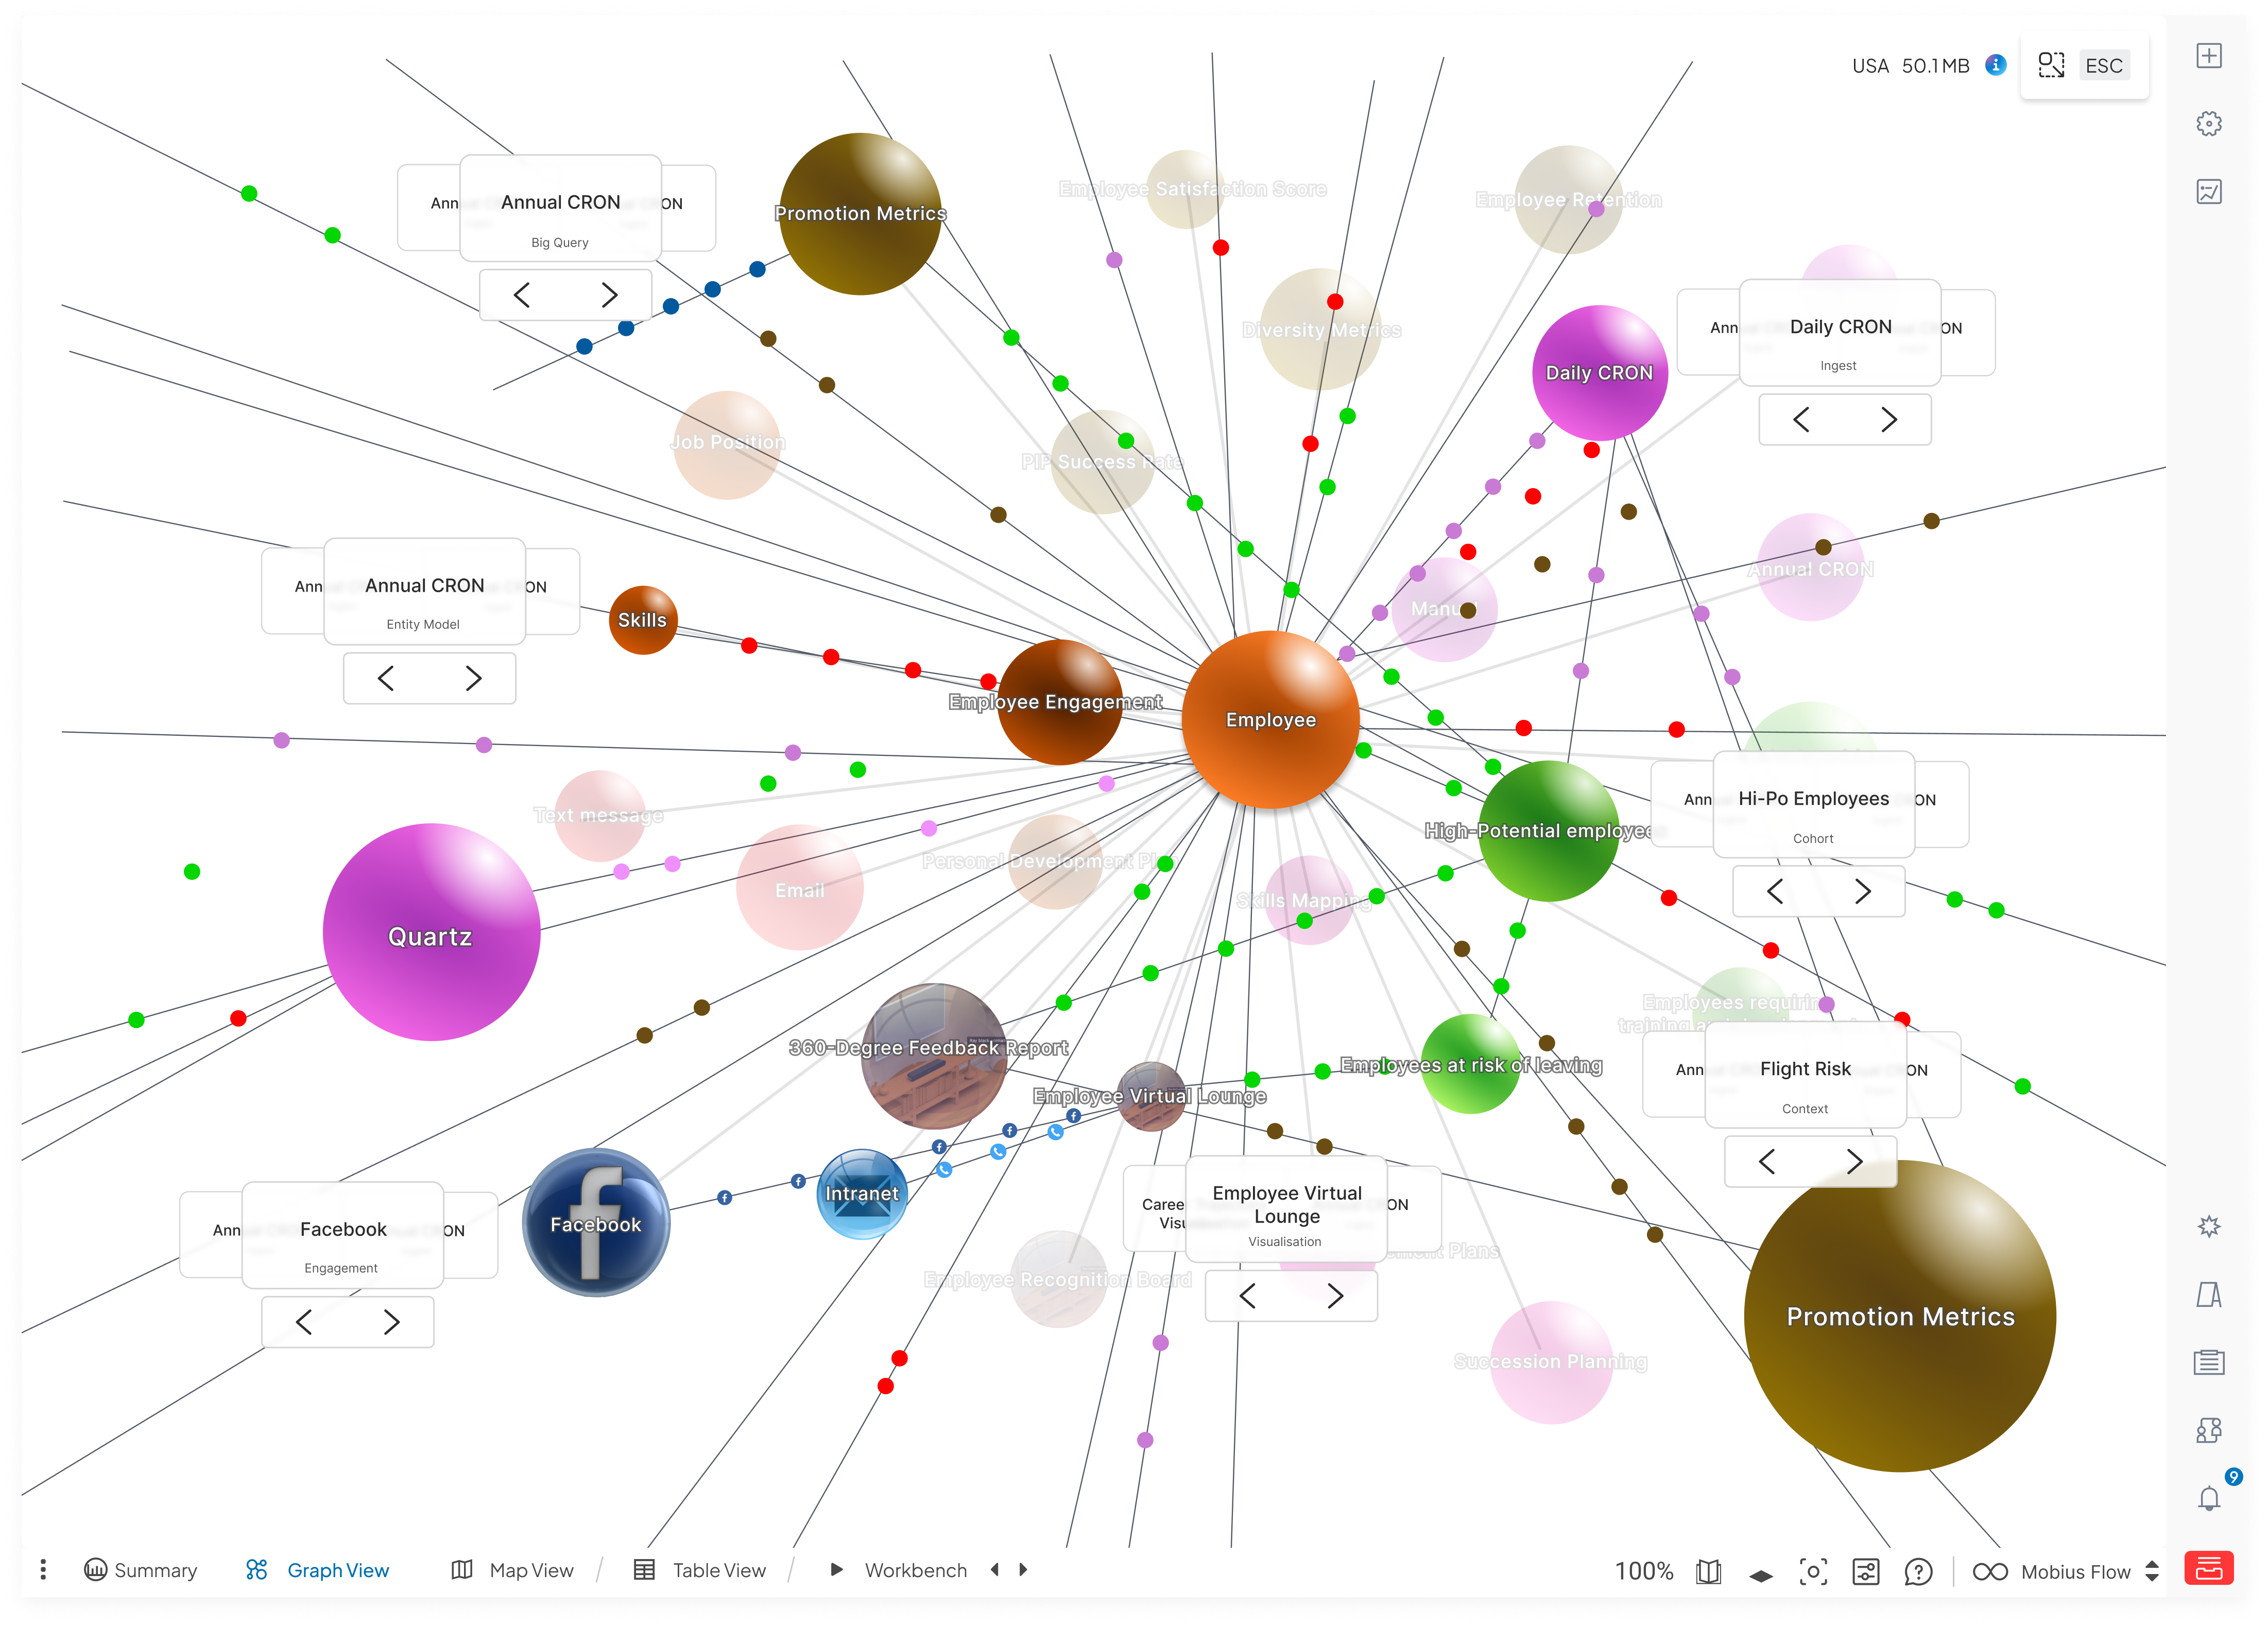
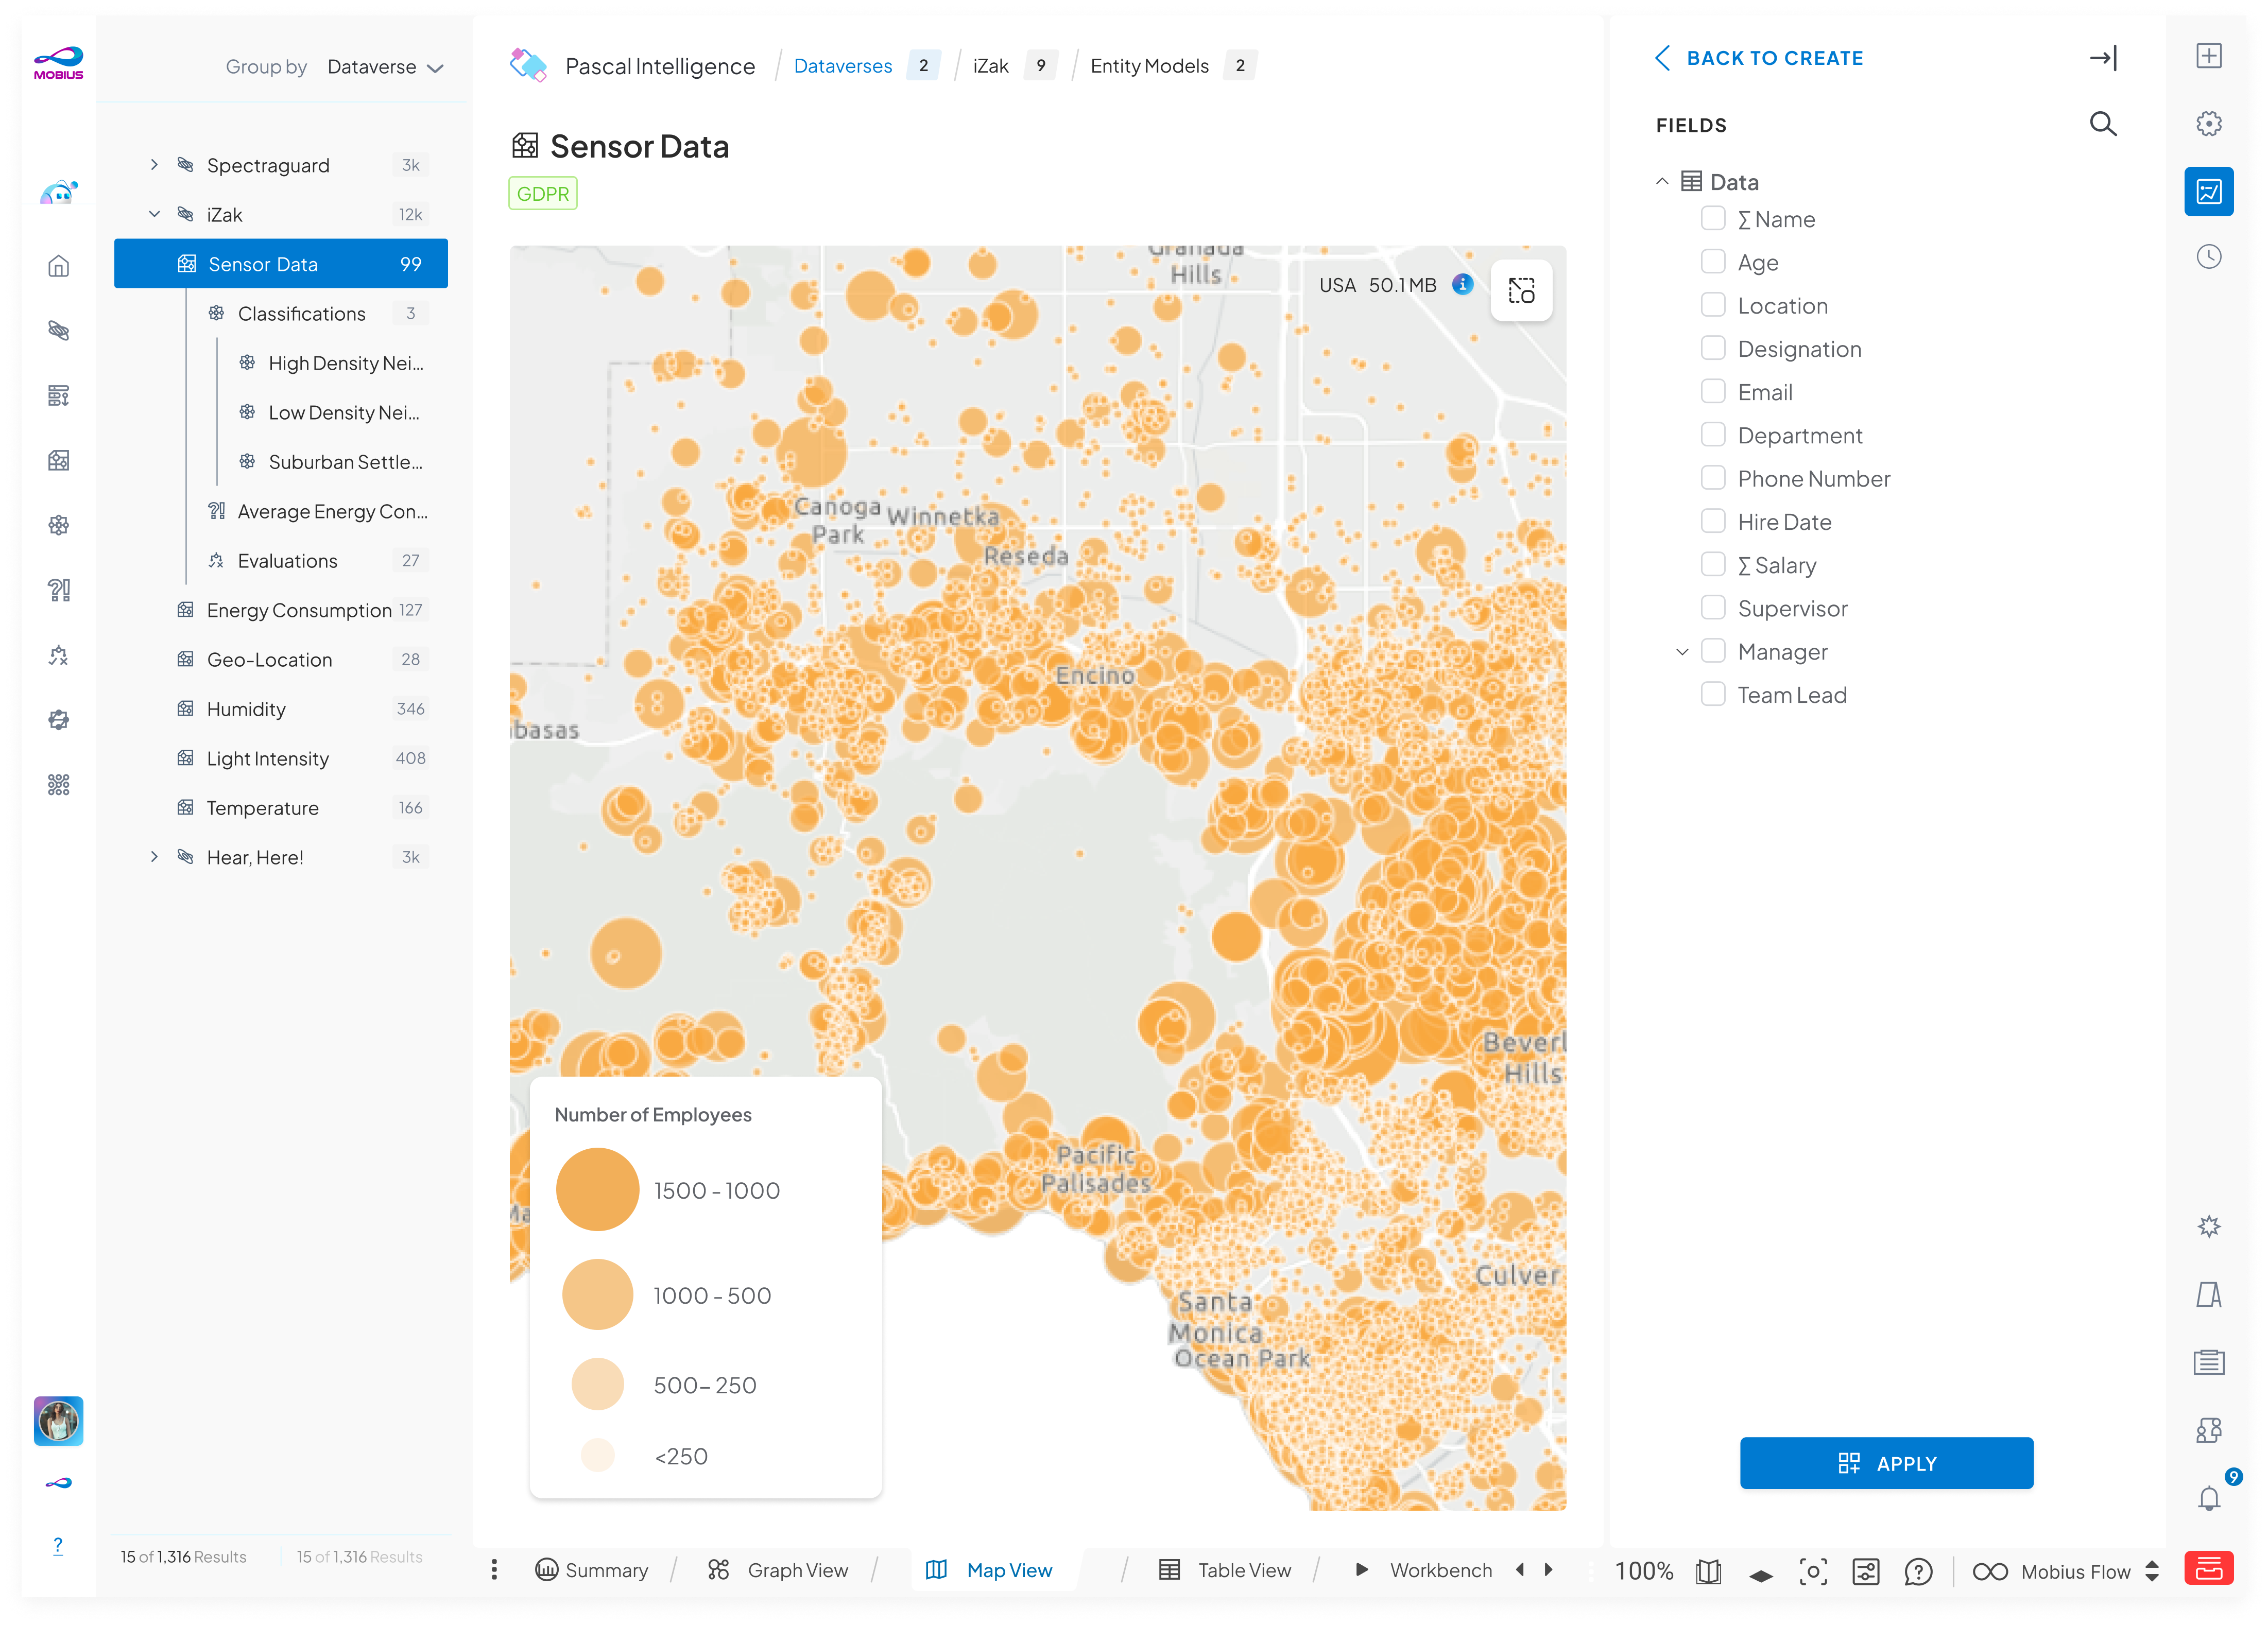
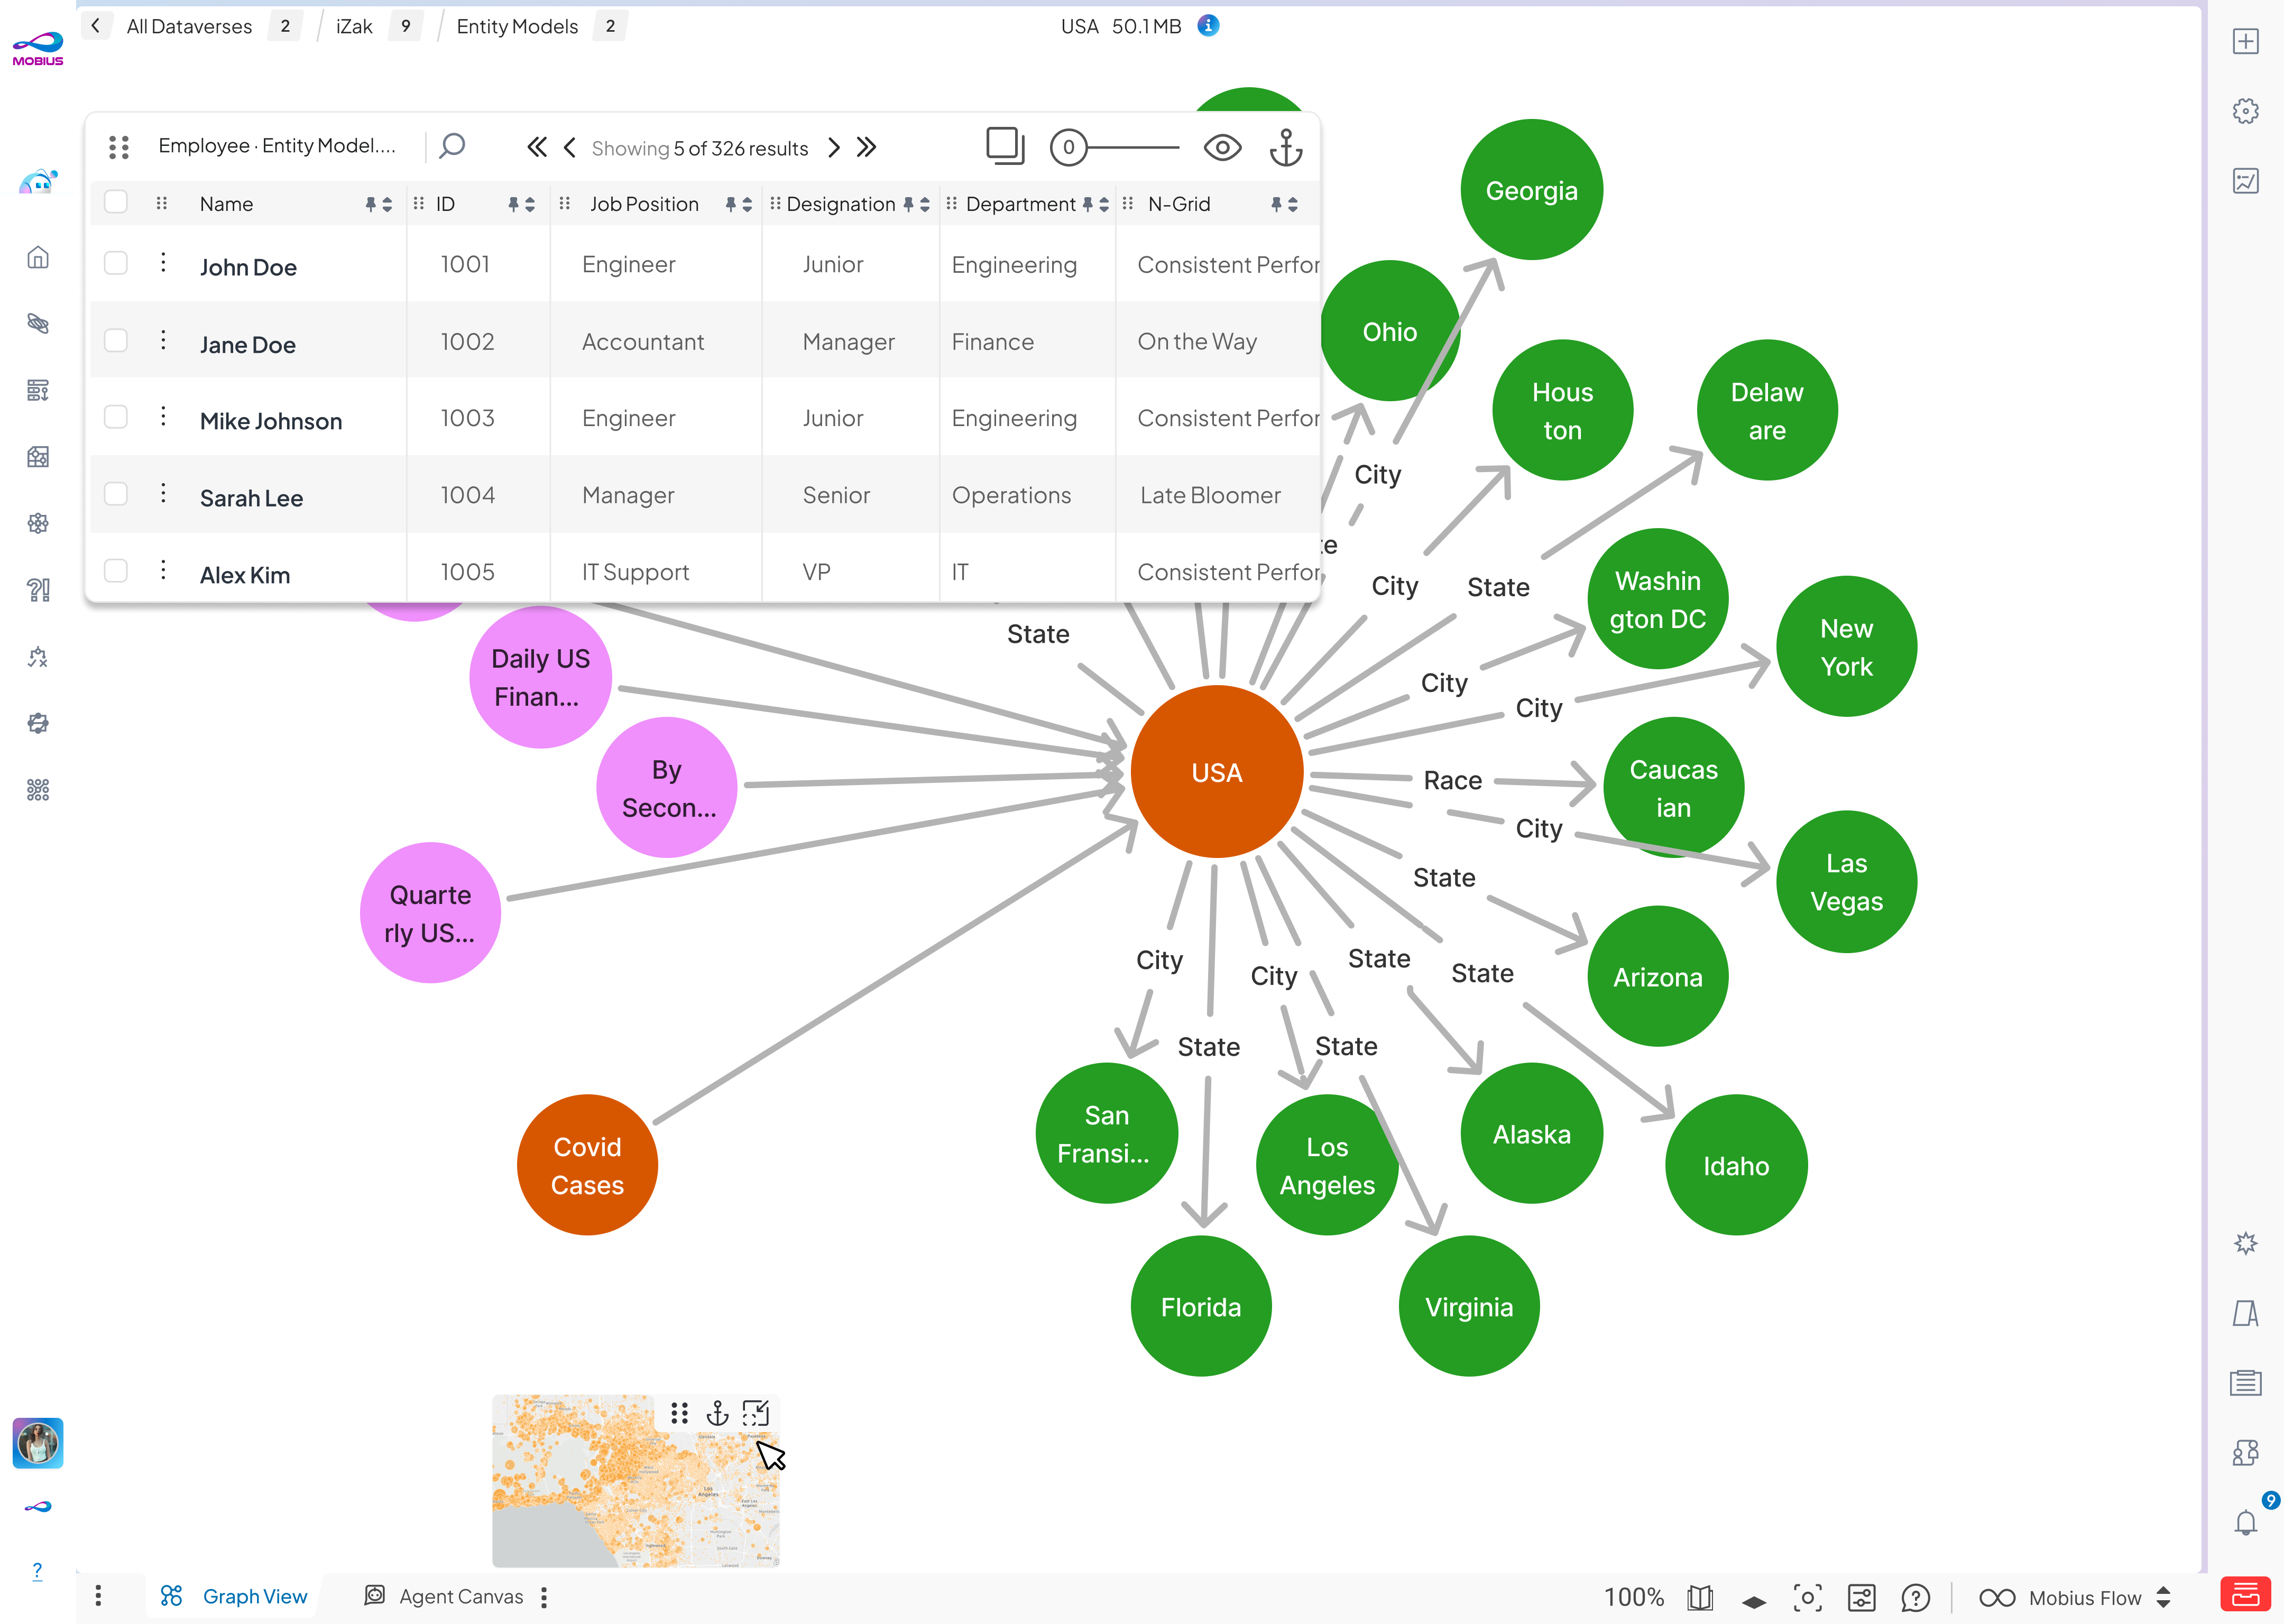
Graph, map, and floating table views kept the platform usable without hiding its underlying complexity.
Make dense data objects inspectable, with focused tabs for schema, privileges, connections, and samples.
Decision · One page or progressive disclosure
The old tool exposed dense objects through floating pop-ups and controls scattered around graph nodes.
The object detail page organized schema, owners and permissions, policies, insights, and a live data sample into a readable, inspectable structure.
Access control designed as part of the product workflow, across roles, users, groups, and teams.
Decision · Governance on the object or a separate admin console
The platform handled enterprise data, so governance could not sit in a separate admin corner.
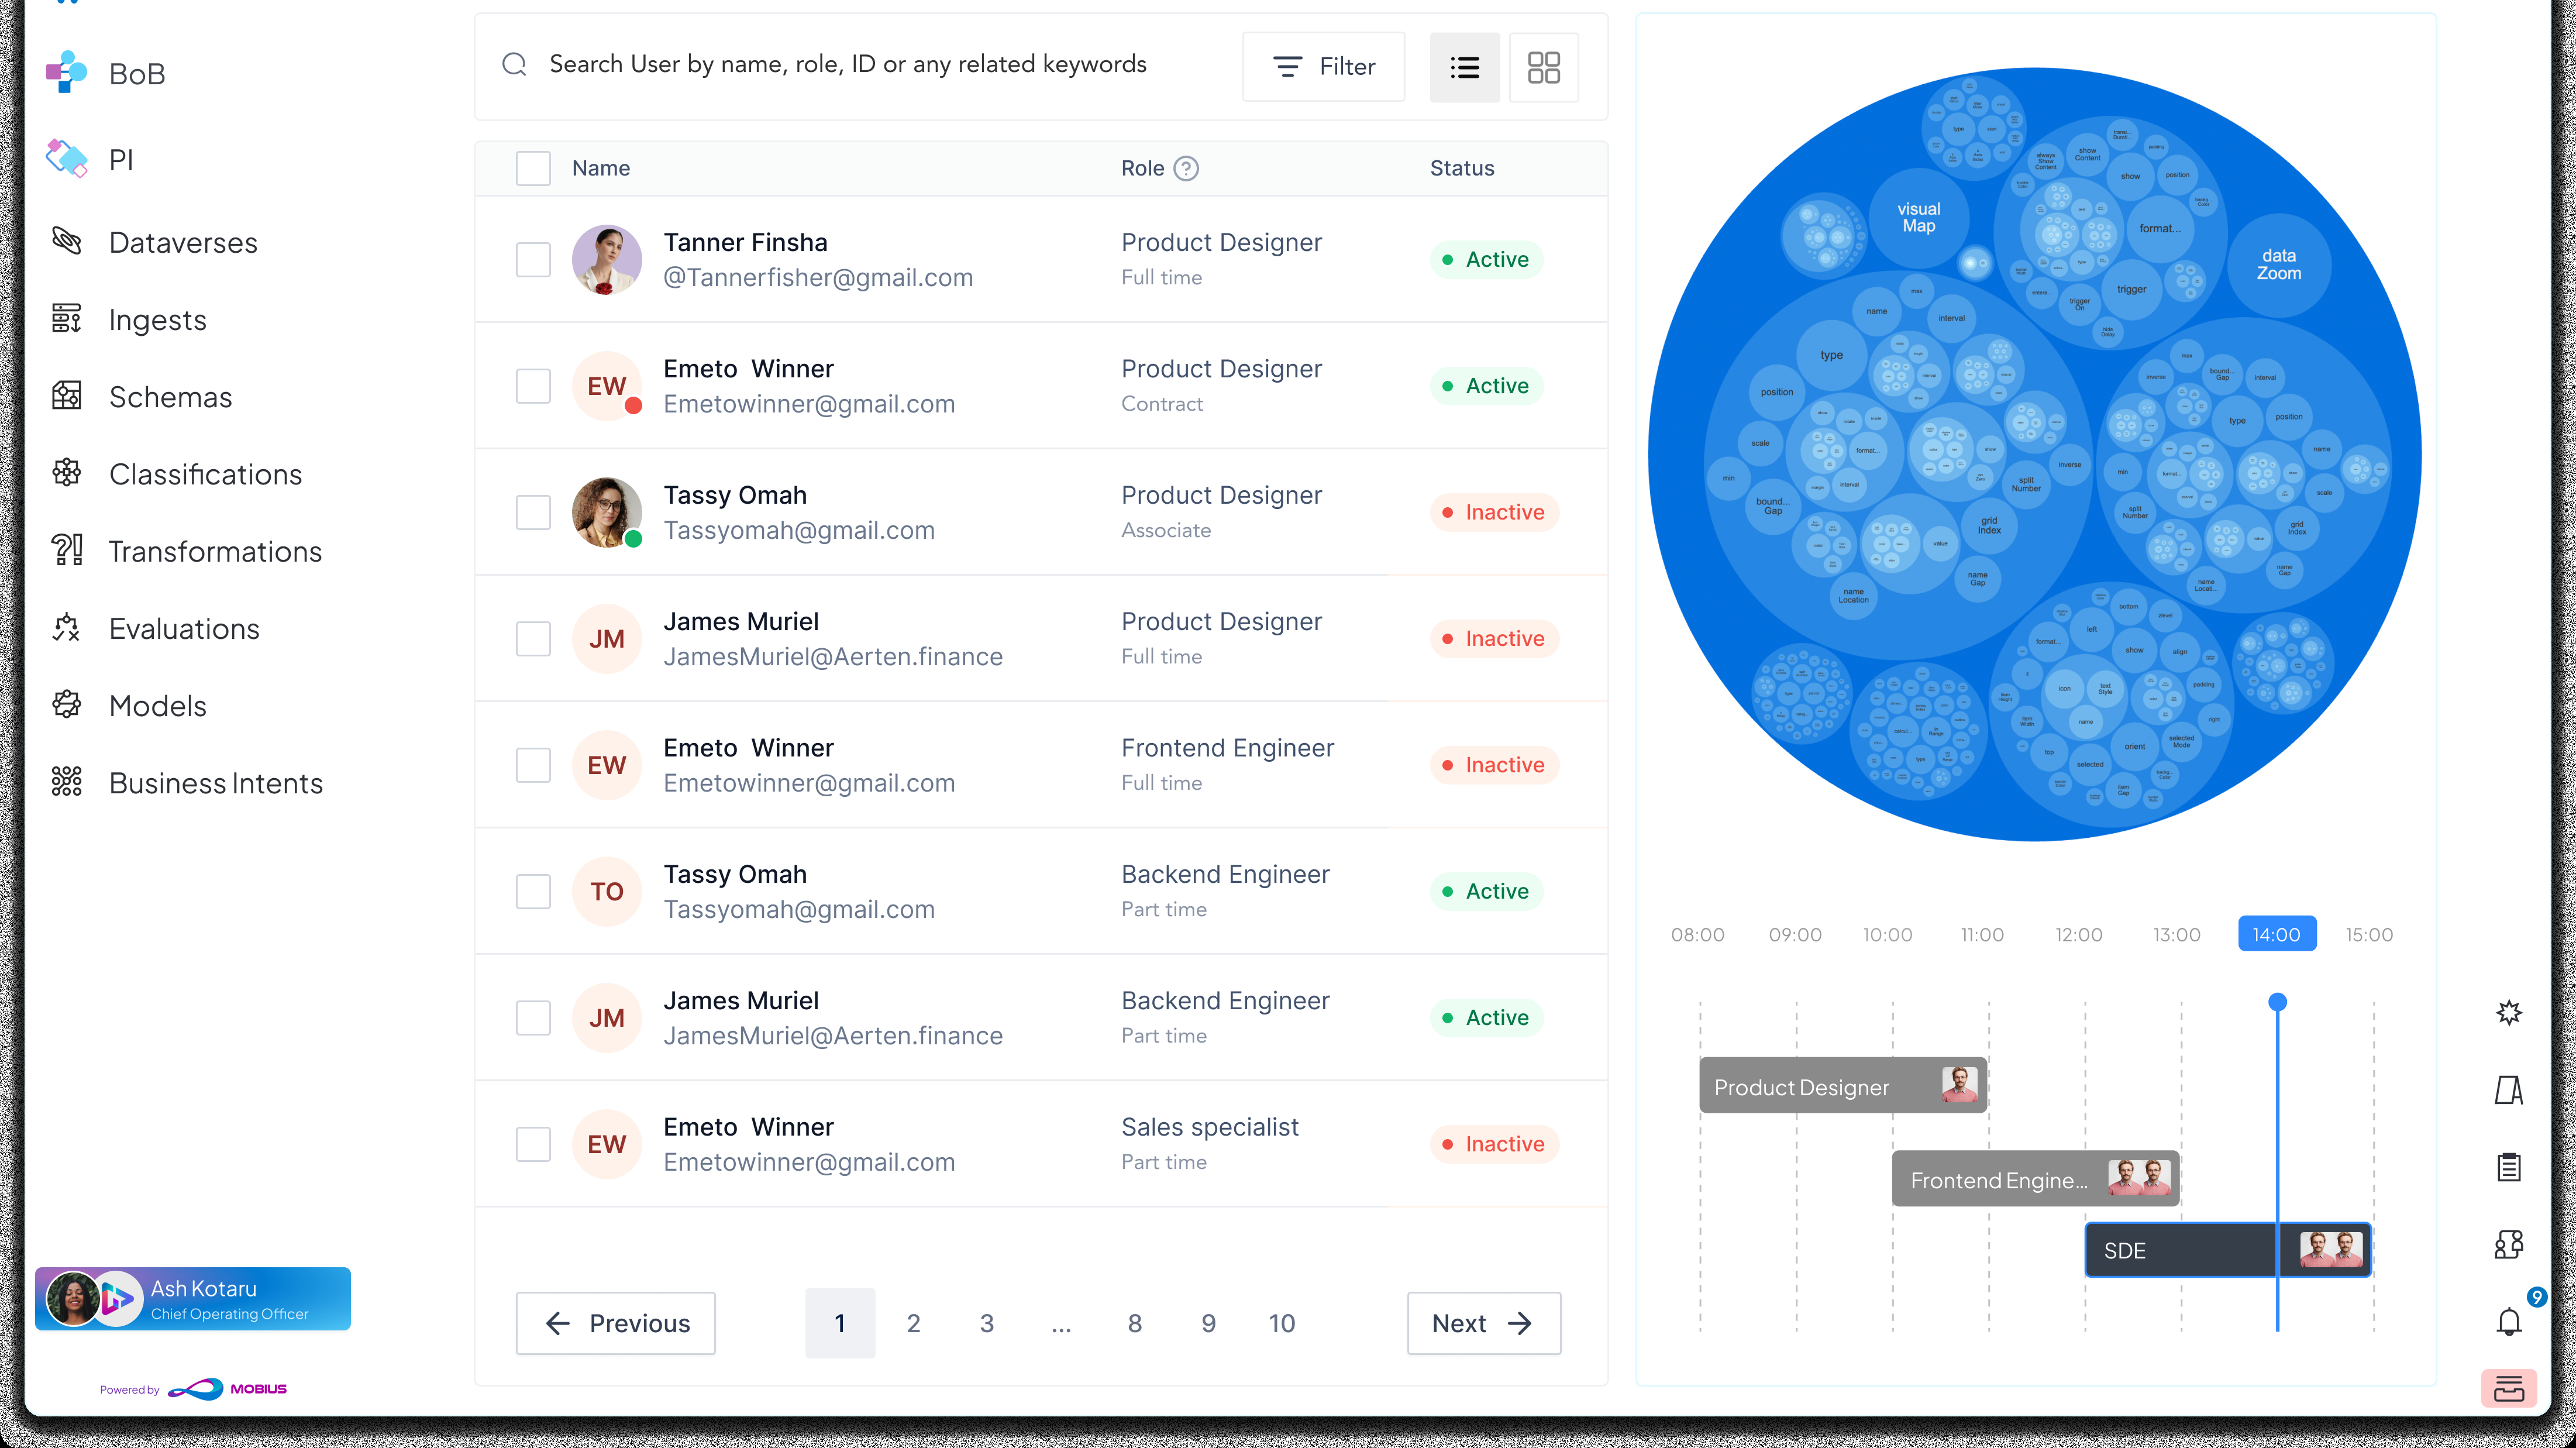
Permissions stayed inspectable and connected to the broader workspace.
Access control, in context
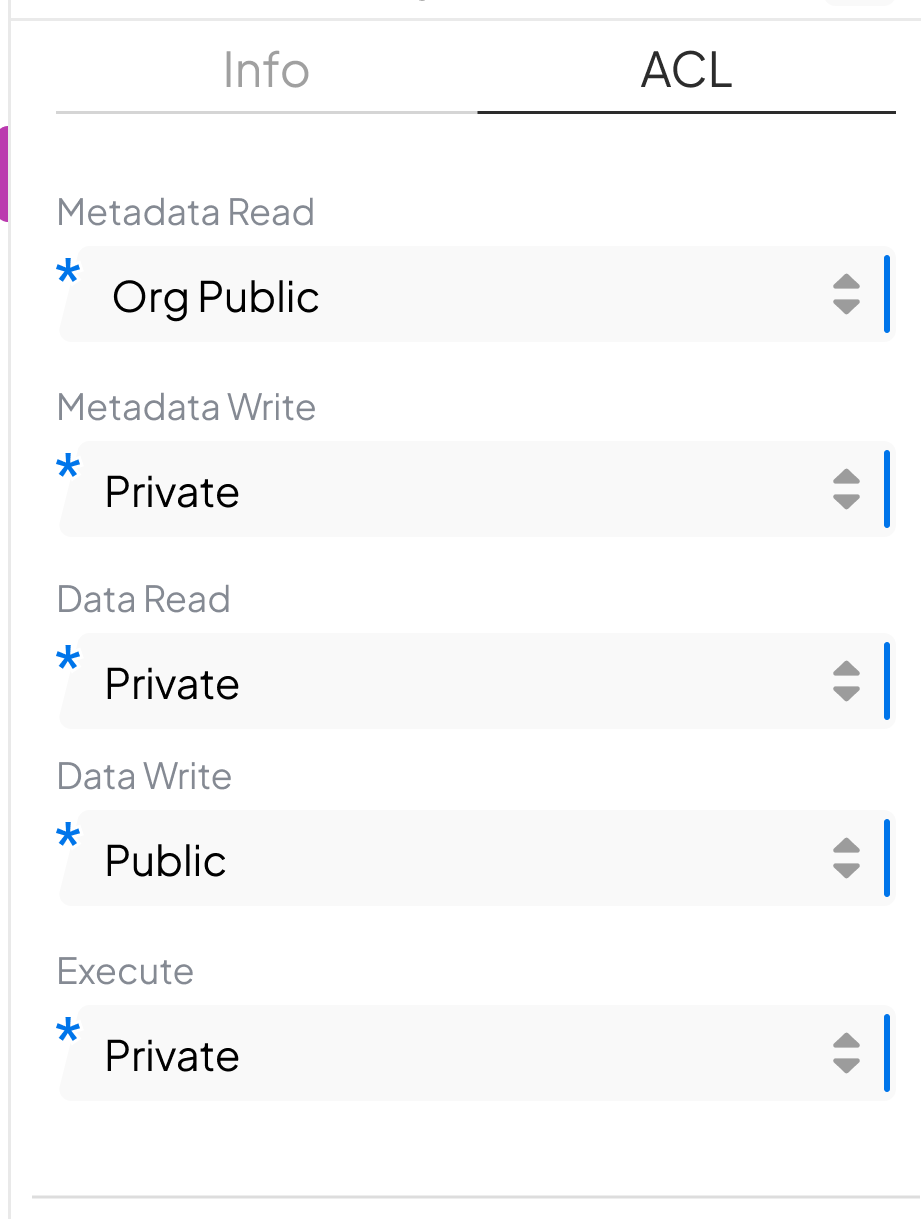
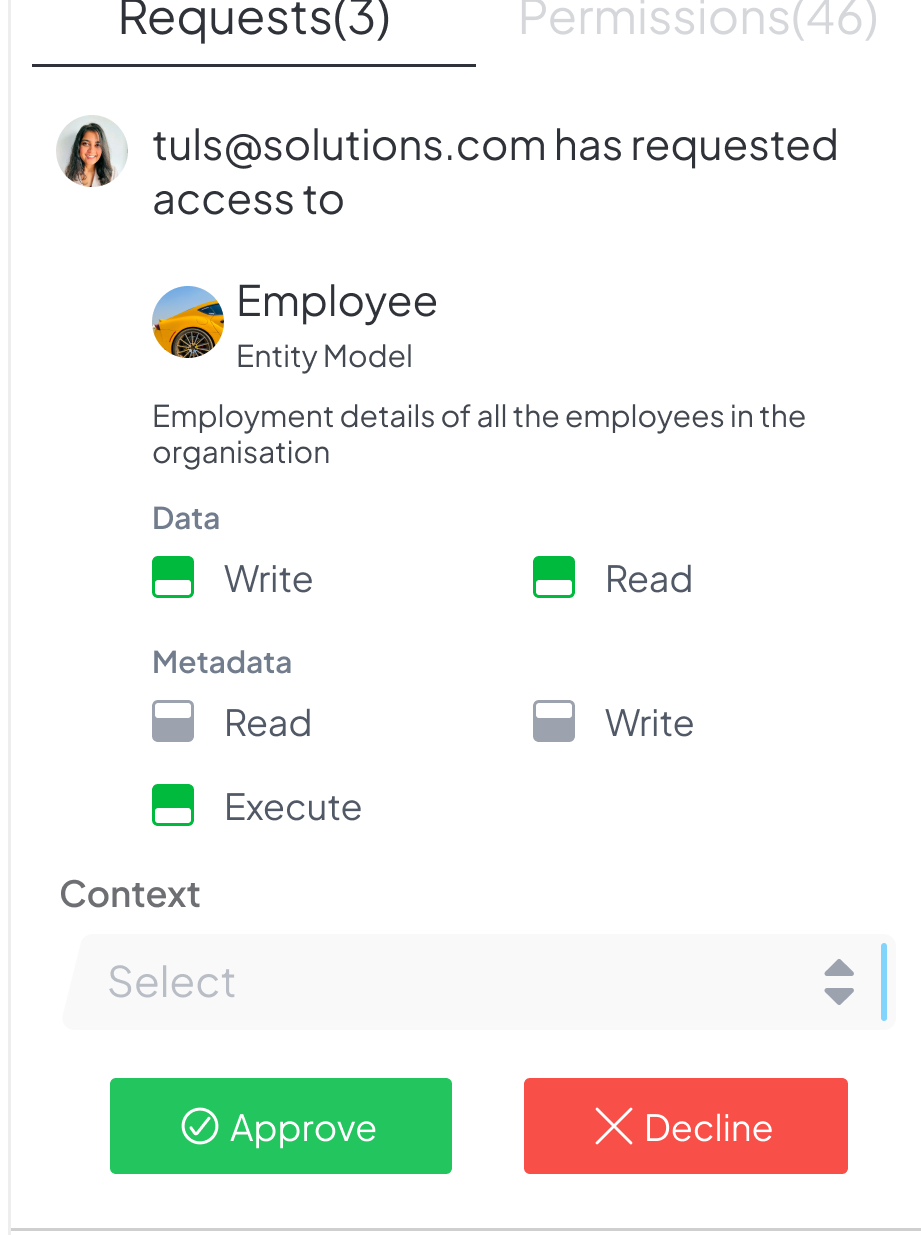
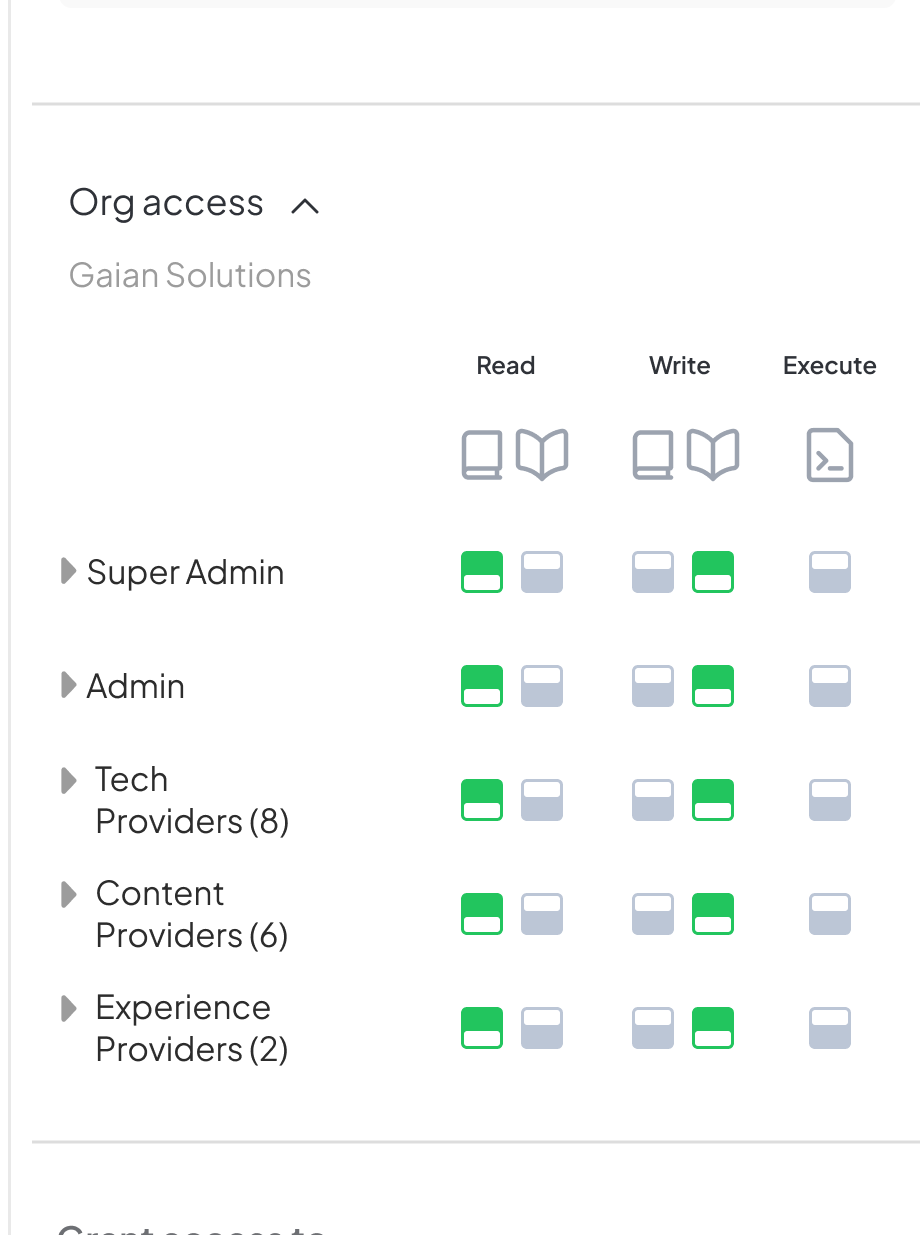
Permissions, external access requests, and the role matrix, handled on the object.
One operating pattern across seven constructs.
Each construct runs on the same pattern: a browsable overview, a selected object, a detail view, a create entry point, edit and manage actions, search, relationship visibility, and access controls where needed.
Decision · One pattern or bespoke flows
Seven constructs, from record-like entity models to action-like engagements.
The pattern held across all seven constructs through the V1 revamp. As the platform added other layers, configuration for Engagements and Visualizations moved out of this layer as those constructs grew. Both remain readable here, with full configuration now handled where those constructs live.
Two journeys the workspace had to make effortless.
Reconstructed from the product’s screens and brief. It covers the everyday path of finding and reading data, and the platform’s end-to-end path from raw data to a governed action.
Discover and inspect data
Business user · Low-code developerFrom “where am I in the data universe?” to understanding a specific object, without navigating like a database administrator.
From data to a governed action
Low-code developerThe platform’s core value chain. It turns ingested data into a contextual, governed engagement fired over a channel.
Three decisions that shaped the workspace.
Each decision states the situation and the choice that followed.
The old tool was graph-first, and its heaviest users navigated by graph.
Seven constructs, from entity models to omni-channel engagements.
Governance placement.
The research behind the decisions above.
Grounding the redesign in the data-architecture landscape.
Before shaping the product, I ran desk research across modern data architectures, then benchmarked vendors and analyst frameworks. The personas and journeys were synthesised from that research rather than from interviews or usability testing, and the case study presents them that way.
“Who has a product here? Which is SaaS, which is self-service? Who are the market leaders, and what are the key features?”
The brief, verbatim.
Products & Services
Features, pricing, SaaS or self-service
Vendors
Experience, expertise, customer support
Case Studies
Real problems solved, benefits, implementation challenges
Trends
Latest developments and their market impact
Eleven technologies studied, seven taken to deep-dive, three walked through end to end.
Mapping how modern data platforms are built.
Data Mesh
Data as a product; domain-oriented, decentralized, self-serve.
Data Fabric
Unified access and management; abstracts and integrates sources.
Data Lakehouse
Warehouse and lake converged for analytics and data science.
Data Vault
Scalable warehouse modelling; hubs, links, satellites; strong lineage.
Data Lake
All raw data captured and stored centrally.
SaaS vs self-service
SaaS
Self-service
Internal capability lenses
Collibra · Informatica
AWS Data Exchange · Data Republic
Data Mesh · four pillars
Insight → design decision
The market was converging on four ideas: data as a product, domain ownership, self-service access, and federated governance.
So PI was framed as a governed, object-centric workspace.
Benchmarking the vendors and their playbooks.
Technologies studied
Vendors taken to deep-dive
Eleven technologies studied, narrowed to seven vendor deep-dives, narrowed to three product walkthroughs. The narrowing was by relevance to the seven constructs this platform already had.
Databricks data-mesh playbook (16 steps, condensed)
Insight → design decision
Every implementation playbook ran the same sequence regardless of vendor: define the domain, catalog what is in it, configure the pipeline, govern access, then monitor.
So the platform's operating model was derived from that sequence and applied to all seven constructs: browse, select, inspect, act, govern.
Vendor walkthroughs
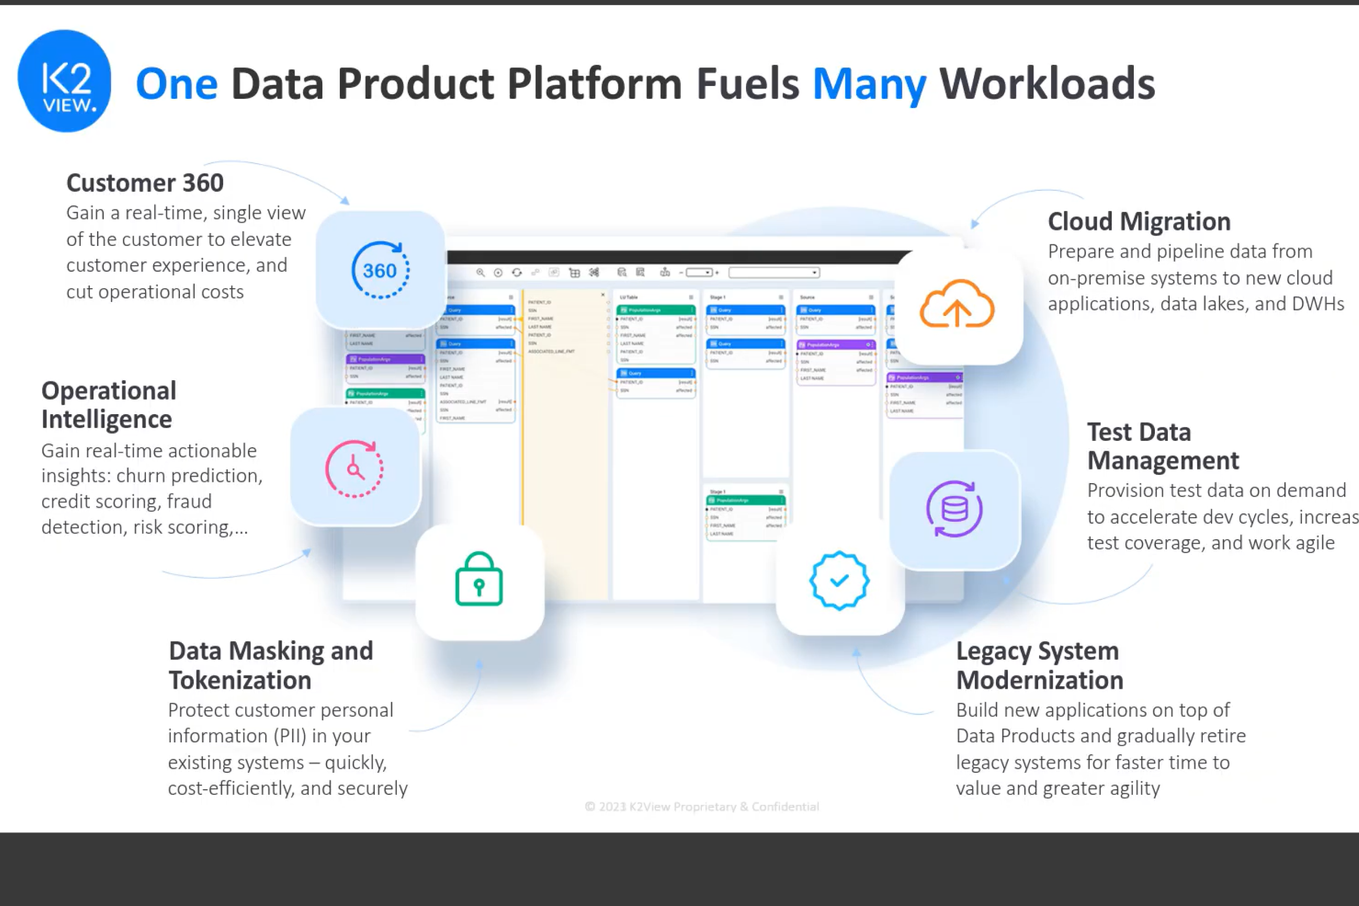
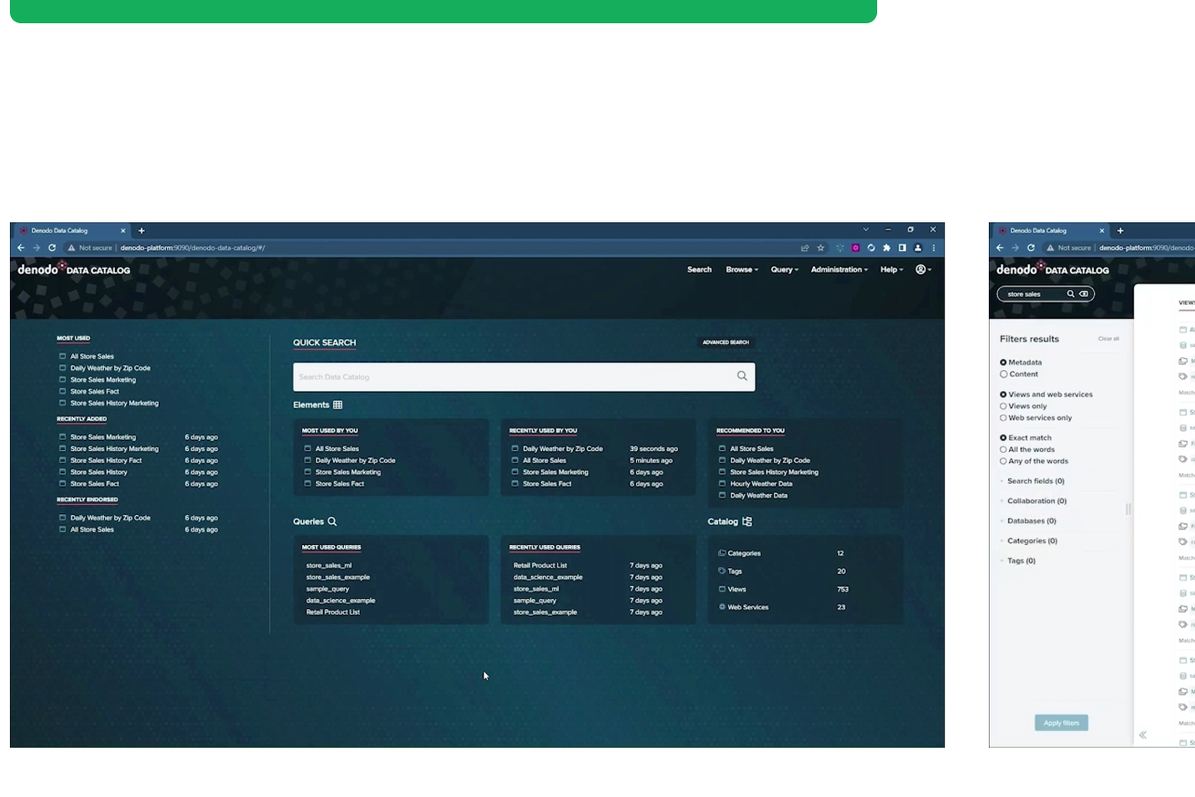
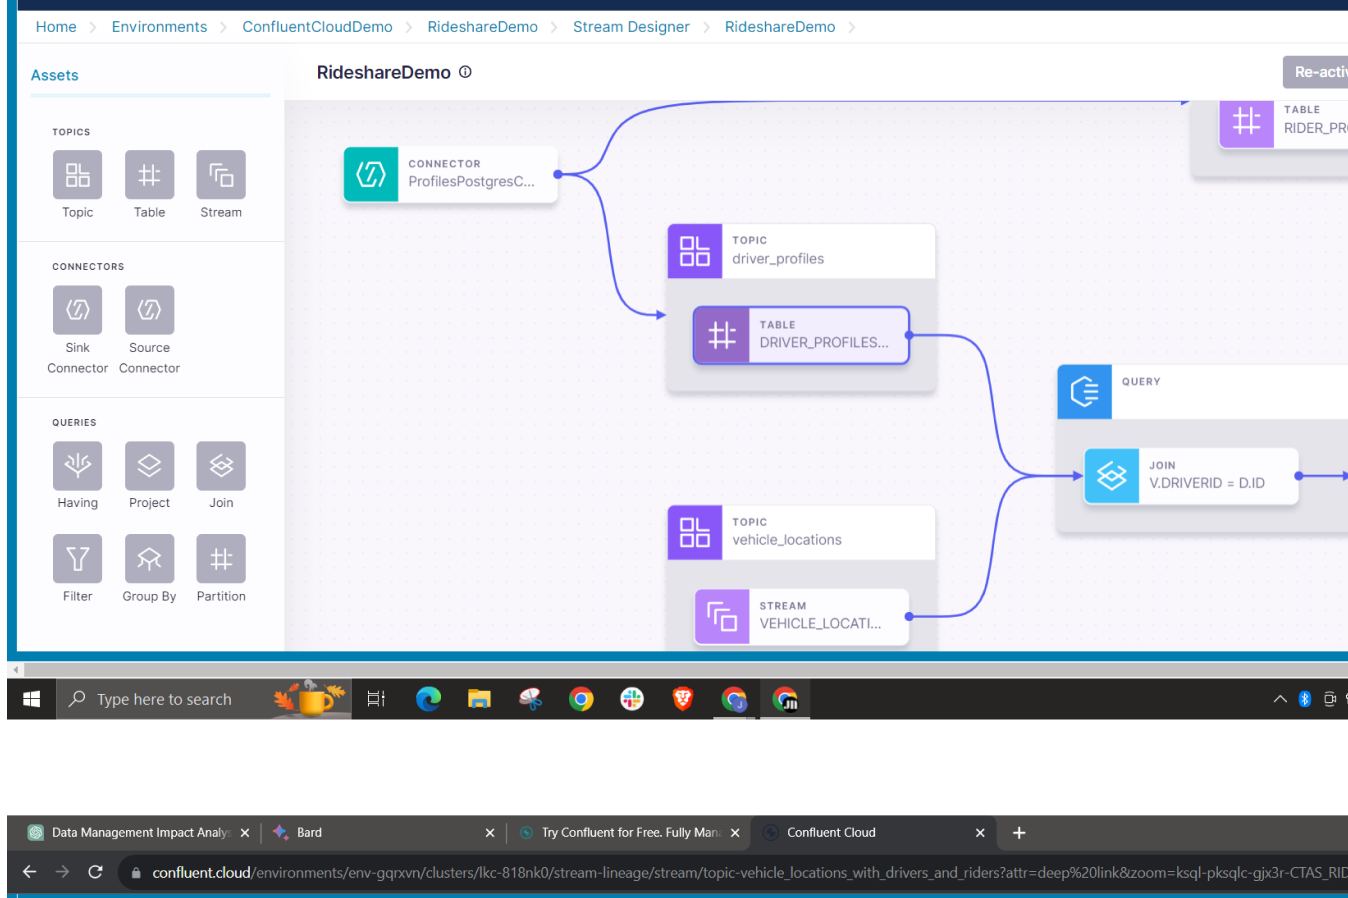
Product walkthroughs from three benchmarked platforms, studied as reference. Screens belong to their respective vendors (K2View, Denodo, Confluent).
Who the platform serves, from leaders to engineers.
Eight data-practitioner personas, synthesised from role and tooling models, arranged from least to most technical.
Data Consumers & Leaders
Excel · Sheets · Power BI · Tableau
Business Analysts
Sheets · BI · SQL
Data Analysts
Python · R · SQL · BI
Data Scientists
R · Scala · Spark · SQL
ML Scientists
Python · Spark · Airflow · Git
Statisticians
Python · R · SQL
Programmers
Python · Scala · Git · Shell
Data Engineers
Pipelines · Spark · Airflow · AWS
What data practitioners spend the most time doing
CrowdFlower / Forbes data-preparation survey (third-party, cited).
Insight → design decision
The roles ran from non-technical leaders to data engineers, and published survey data put roughly 60% of practitioner time on cleaning and organising data.
So the redesign served two practical groups, business users and low-code developers, and put schema inspection, live data samples, and standardized CRUD at the centre.
Structuring the domain into nine capability areas.
An open card sort organised roughly seventy data-domain terms into nine capability areas, giving the product a shared vocabulary to build around.
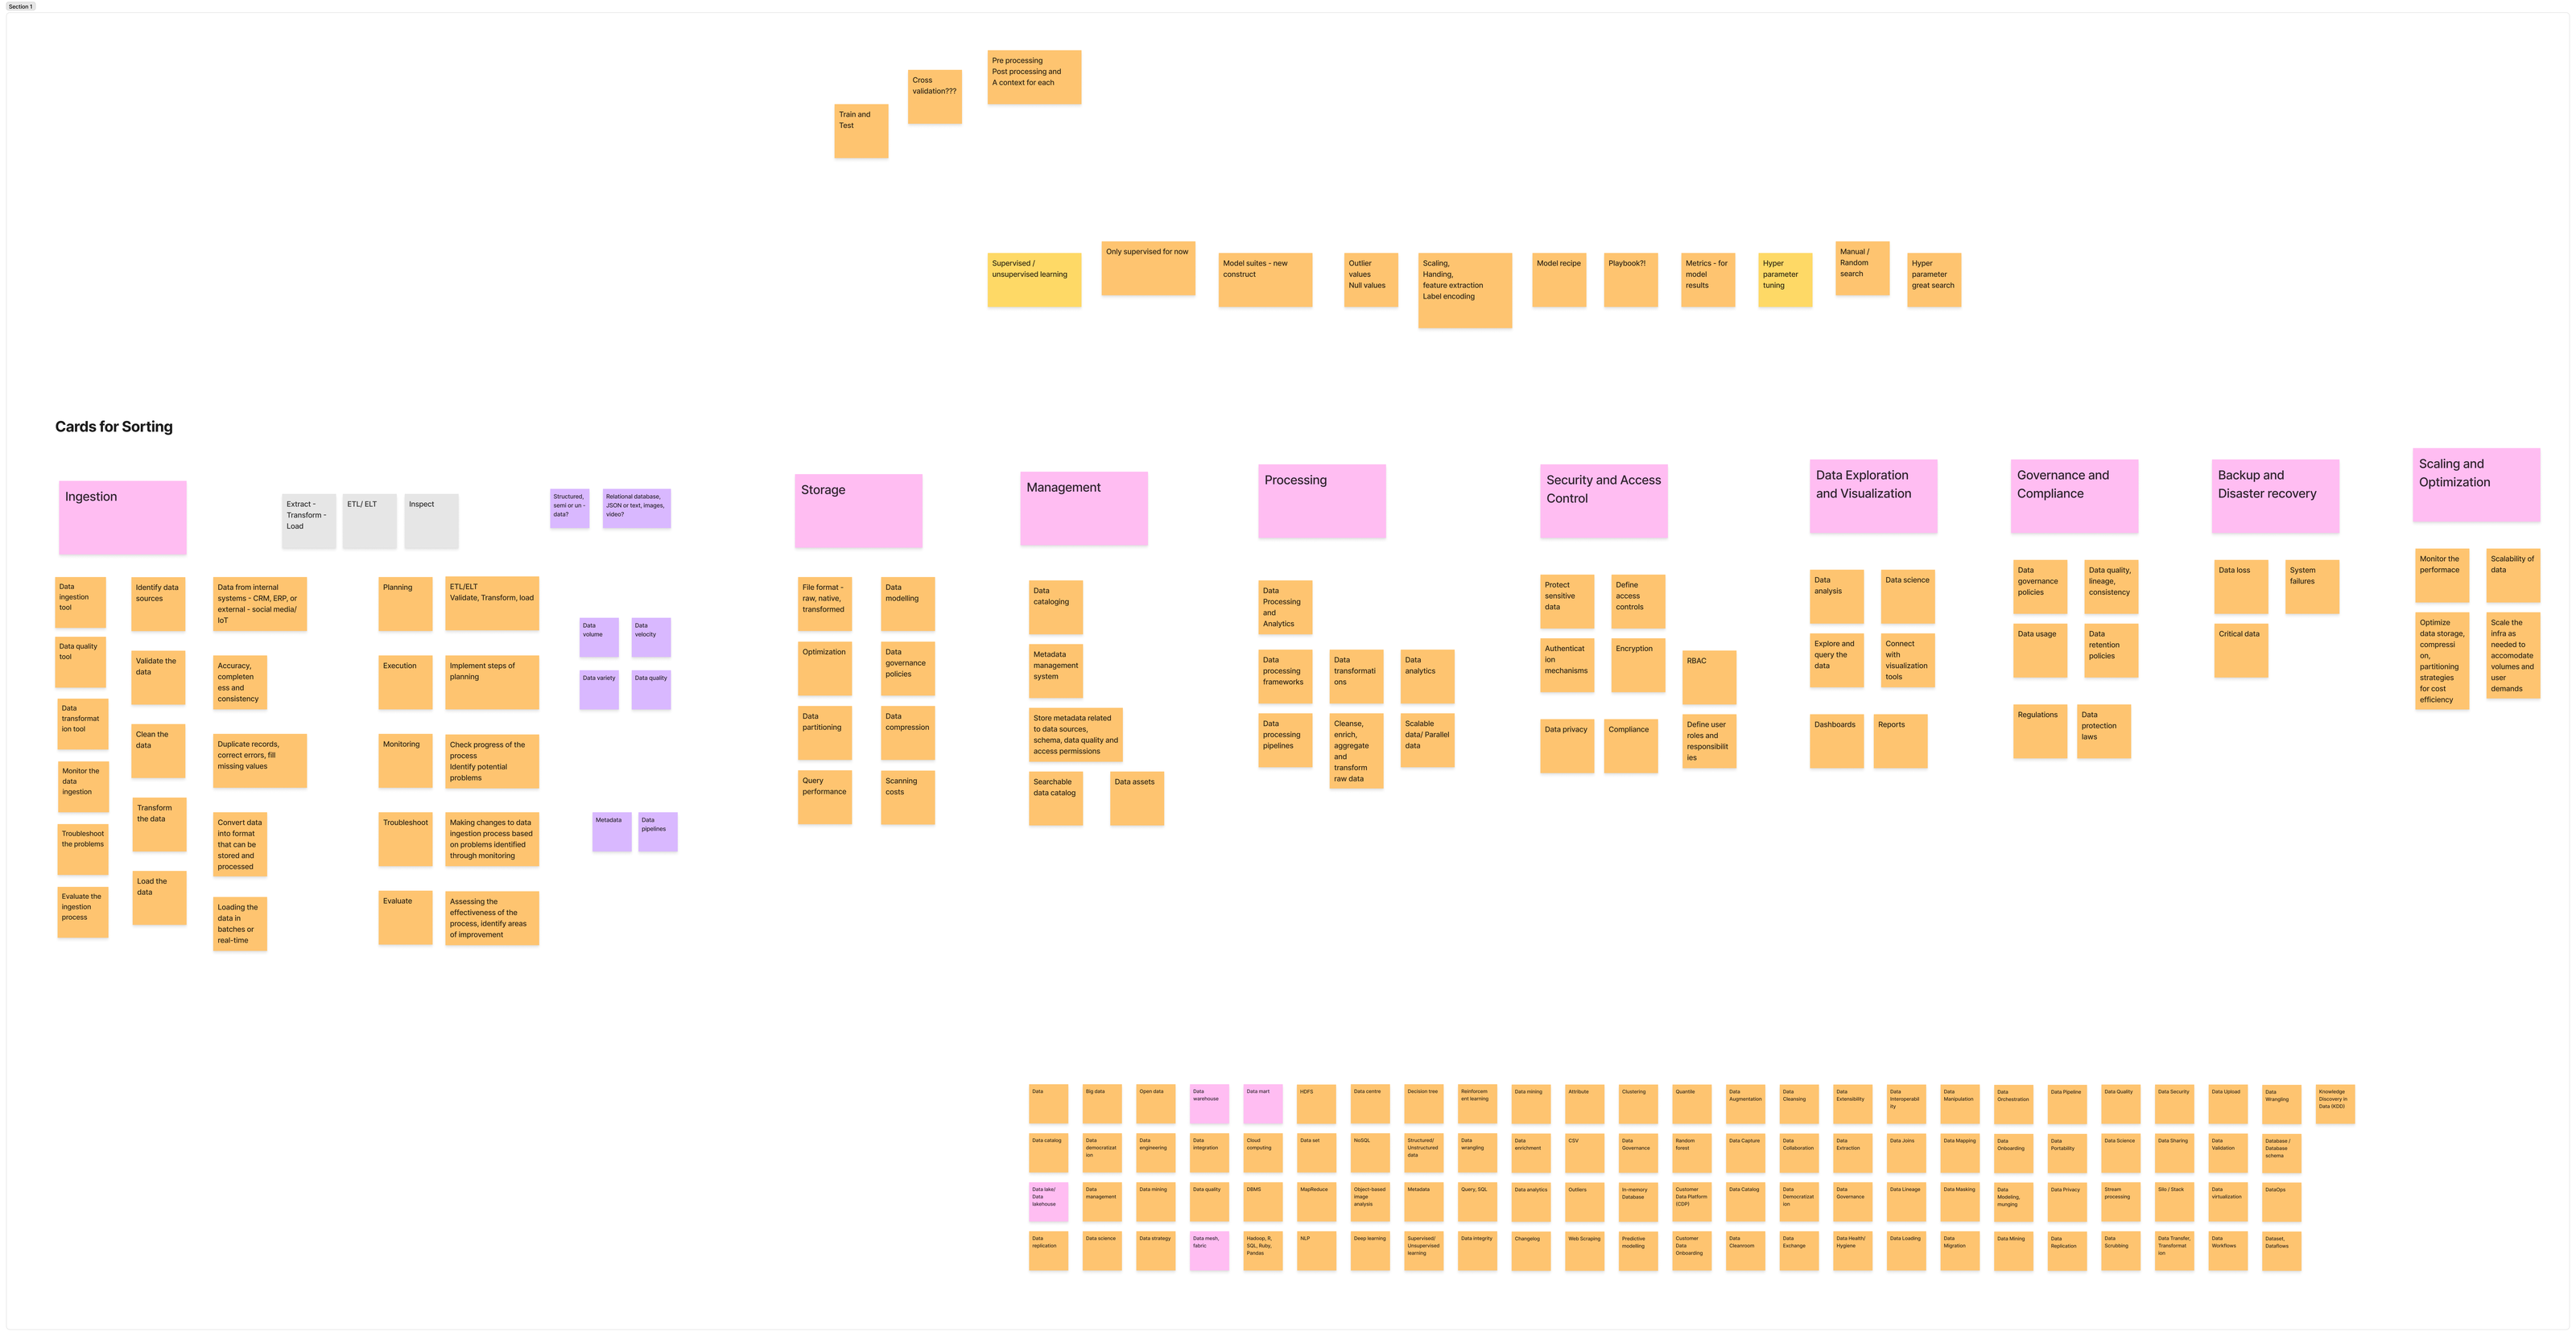
The full sort. The nine capability areas it produced are distilled below.
Ingestion
Sources, quality, validation, transform, load, monitor
Storage
File formats, modelling, partitioning, query performance, cost
Management
Cataloging, metadata, searchable catalog, data assets
Processing
Frameworks, pipelines, transformations, analytics, scale
Security & Access
Access controls, auth, encryption, RBAC, privacy
Exploration & Visualization
Query, analysis, dashboards, reports, data science
Governance & Compliance
Policies, quality, lineage, retention, regulations
Backup & DR
Data loss, system failures, critical data
Scaling & Optimization
Performance, scalability, cost efficiency, storage strategy
Six of the nine mapped onto constructs the platform already had. The remaining three, management, governance, and security and access, had no consistent home in the old interface.
Insight → design decision
Management (cataloging, metadata), governance, and security & access recurred across the sort as core capability areas.
So PI treated cataloging, schema, connections, and access as first-class, sitting alongside discovery, modelling, and context.
A 12-role, 16-step responsibility matrix.
The study built a Data Mesh operating model mapping twelve roles against a sixteen-step implementation process. The Databricks playbook and the competitor journeys all share this same spine.
The 16-step spine
The 12 roles
How data actually moves, end to end.
The board captured a logical data flow, a pipeline lifecycle, and three end-to-end journeys from competitor platforms. The journeys are reference flows from Databricks, WhereScape, and Confluent, condensed here to the common shape they share.
Logical data flow
Pipeline lifecycle
Common competitor journey (Databricks · WhereScape · Confluent)
What the research established.
The derivation, at a glance
Research inputs on the left, the design decisions they produced on the right. The four paradigms, the nine capability areas, and the operating model all converge on the object-centric workspace.
Research input
Design decision
Four data-architecture paradigms converging on data-as-product, domain ownership, self-service, and federated governance
A governed, object-centric workspace where each construct is browsable, inspectable, and owned
Self-service platforms, not managed SaaS, as the closer comparison set
A workspace assuming a low-code developer operating without a platform team
Enterprise Data Ownership and Data Source Management treating ownership as primary
Ownership and cataloging as first-class tabs on the object detail page
Eleven technologies, seven vendor deep-dives, and three product walkthroughs
Object detail centred on schema, connections, data samples, and access, with the graph as one view among several
An eight-persona model spanning non-technical leaders to data engineers
Two served groups: business users and low-code developers
Roughly seventy domain terms sorted into nine capability areas
Cataloging, schema, connections, and access treated as first-class alongside discovery, modelling, and context
A 12-role by 16-step Data Mesh operating model
Work modelled around objects that can be created, cataloged, governed, and consumed
Three competitor journeys sharing one sequence
One operating model across all seven constructs: browse, select, inspect, act, govern
The product moved from graph-heavy complexity to a structured, governed workspace internal teams could build on.
Completed over 4–5 months. Most of the experience shipped and became a usable internal tool for teams building low-code apps; some items stayed in the engineering backlog. No inflated metrics. The value was a complete, consistent operating model.
A usable internal platform tool
The redesigned experience became the tool internal teams used to build low-code apps.
Seven constructs standardized
One CRUD and inspection pattern spanned all seven constructs.
Graph complexity made operational
The product moved from graph-heavy navigation to a workspace with hierarchy, tabs, tables, maps, and contextual actions.
What the work established
The operating model was derived from market convergence rather than observed behaviour, which set a high bar for the research behind it. The pattern held across seven constructs with little in common, which is the strongest available evidence that the model was right. The next step is testing it with the developers who used the original graph.
Thank you for exploring this project.
Enterprise Data Intelligence Platform · Tulika Pandey · 2024