
Every AI agent Mobius sold needed its interface designed by hand. I built the system that generates it instead.
Mobius sells AI agents to enterprises through a marketplace. Every agent already carries a structured model of what it knows and does: its intents, the things it manages, the actions it can take, the rules it operates under. I designed MetaUX, a pattern that reads that model and produces the interface from it, so screens follow from the agent instead of being drawn for it. Operators run the agent. Builders configure it. Both come out of the same model.
1 day
baseline interface setup, previously 3 to 8 weeks design plus 1 to 3 months development
4 live, 40+ queued
agents on the pattern, clients waiting on deployment
~80%
of agent journeys the pattern covers, canvas screens excluded
- Visual identity per agent. Every agent renders in the same UI and only the content changes.
- Canvas-based agents, known before rollout and still open.
My role
Manager, Agent Experience Engineering
[[DURATION_PLACEHOLDER]]
Team: 3 designers and 10 developers, with a direct line to the VP of Engineering
- UX architecture and pattern definition
- Operator and builder experiences
- Rollout to product owners building their own agents
The scale problem behind the marketplace.
Mobius builds AI-powered digital transformation products through agentic marketplaces. Enterprises discover, purchase, configure, and deploy agent products, each carrying capabilities, business logic, a knowledge graph, and governance rules.
Challenge
The marketplace covered discovery and deployment, but not the interface. Every purchased agent still needed screens designed by hand, so delivery ran at the speed of design.
Where it showed up
In the business strategy
Agents sold faster than they could be put in front of users. Demand queued behind design capacity.
In the product
With no reusable interface architecture, every new agent and client variation became a custom build.
In the experience
Journeys differed between agents, patterns were redrawn each time, and delivery stayed slow.
How the pattern emerged.
The pattern came from repeated design work. By the fourth manual agent build, the same design decisions were recurring: every agent needed a dashboard, every entity needed a listing, and every listing needed the same search, filter, and action controls.
So I ran the exercise directly, cataloguing the components that appeared across agent interfaces and the variants inside each one. Forms, table lists, card listings, canvases. Cards with images and without, with statuses and without.
The exercise turned up the connection I needed. A list is data from a schema, and that schema is itself an object in the agent's graph. The component was never really a design choice: it followed from the object and the attributes it carried. That meant the interface could be resolved by conditional checks against schema attributes rather than redesigned per agent.
| Component | Variants found | What selects the variant |
|---|---|---|
| Card listing | with media, without media · with status, without status · with counts | presence of a media attribute, a bounded enum, a countable relation |
| Table list | selectable rows · row actions · paginated | Event nodes on the entity, number of records |
| Form | create · edit · read only | the same schema as the listing, narrowed by Business Laws |
| Detail | single column · split with execution panel | whether the entity carries Result and Trace nodes |
| Dashlet | metric · trend · comparison · distribution | the shape of the Result being expressed |
| Canvas | graph · workflow · artifact | not derived. built per agent, the one exception |
The catalogue is the exercise. Once the variants were written down, the selection between them turned out to be a conditional check against schema attributes, not a design decision.
What every agent had in common was the graph: a structured model of intents, entities, actions, results, laws, processes, and traces.
Pushback
Several product owners expected they would not be able to configure objects themselves. That came from not having worked with the graph structure before, not from a problem with the pattern. Walking through two graphs, showing where their objects sat and how the same pattern resolved against each, settled it.
Mapping who moves through the product, and where.
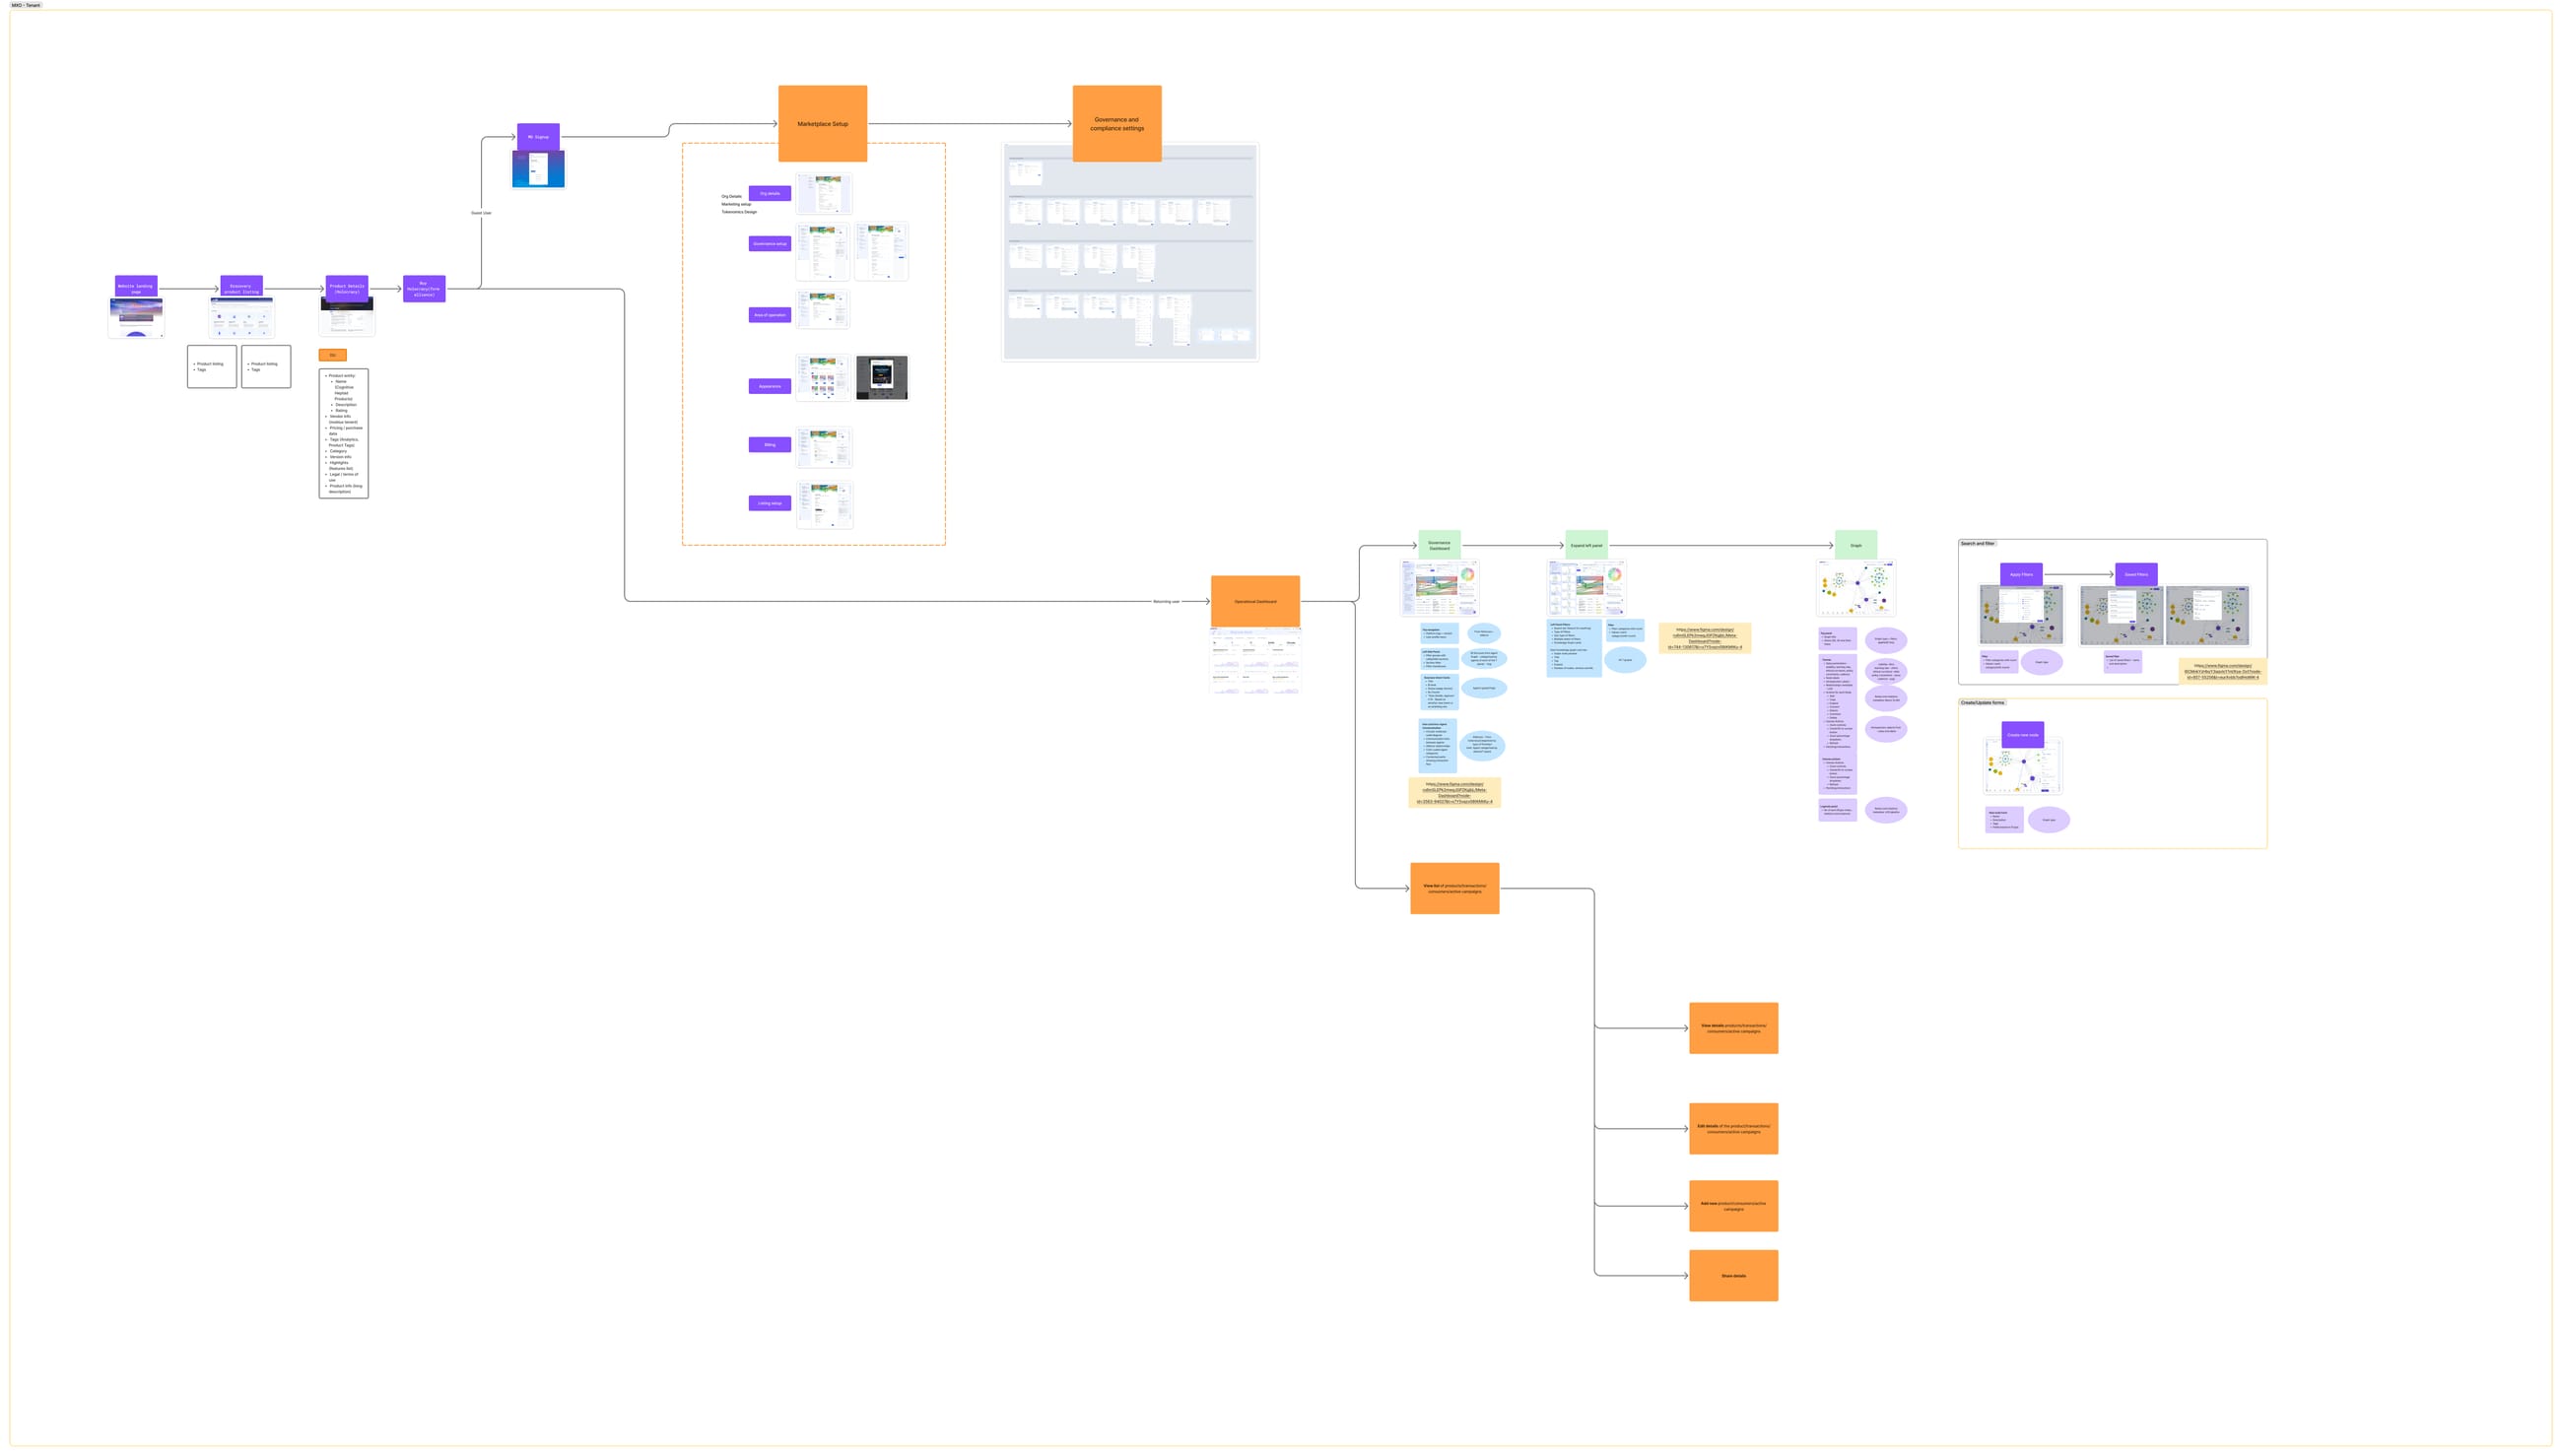
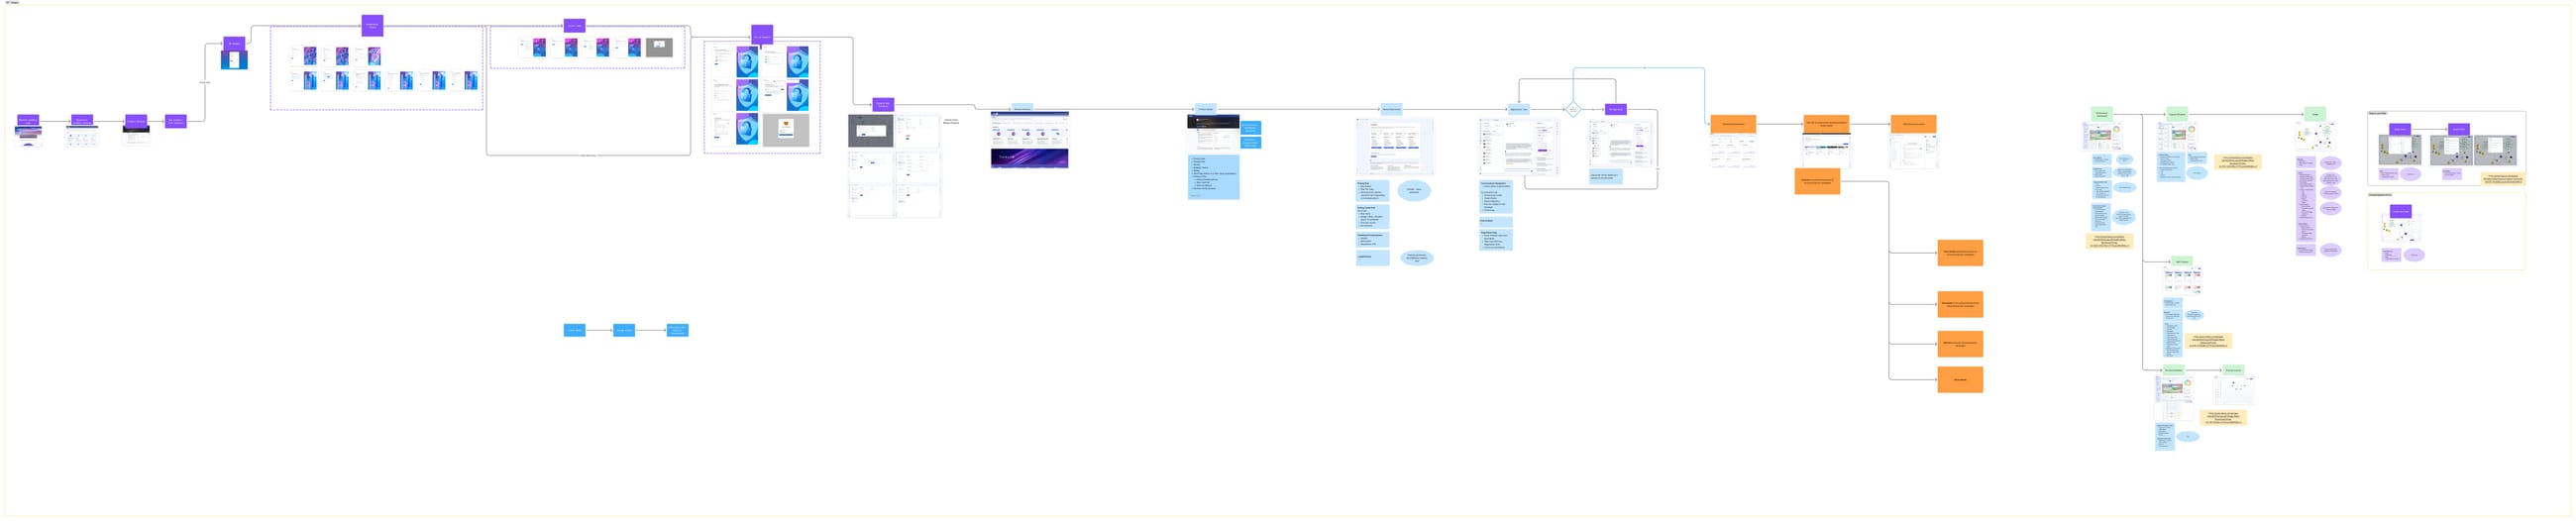
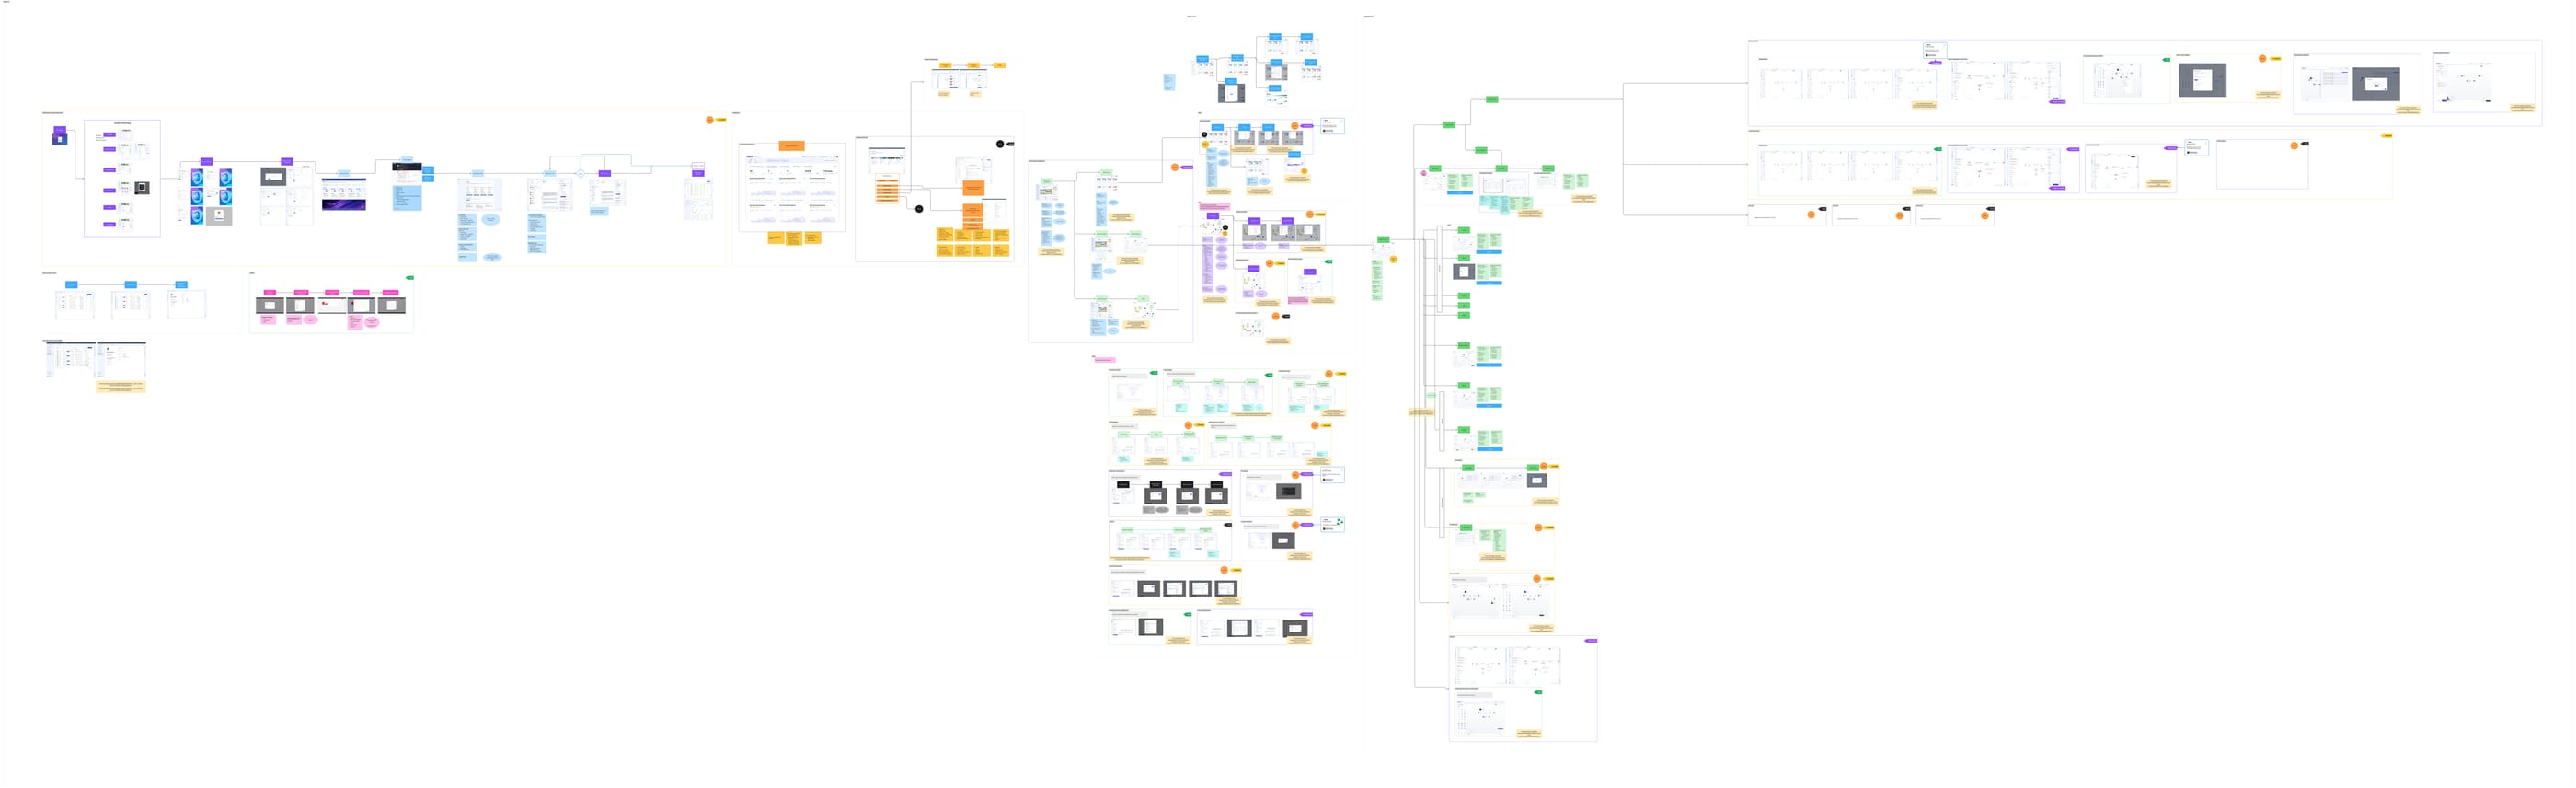
Marketplace operators, tenants, and builders reach different surfaces for different reasons. Every path was mapped against the information architecture before the grammar was written, because the pattern only holds if all of them resolve to the same underlying structure. The simplified version below is readable; the working maps are what it was drawn from.
Redrawn from the working maps below. Use the controls to isolate a path.
A reusable grammar for agent interfaces.
Each agent already had a structured graph of intents, entities, actions, results, laws, processes, and traces. Instead of inventing screens for every agent, the interface is composed from graph node types and their relationships.
Intent becomes a dashboard
Each Business Intent becomes a dashboard tab. Users switch between dashboards based on what they are trying to achieve.

Rule 1 · the intent switcher. Each Business Intent is one tab.

Rule 2 · the schema’s records as object cards, with the standard listing controls above them.
Entity becomes object cards, lists, and details
Business Entities appear as object cards on dashboards and expand into listing pages with a card/table toggle, search, filter, sort, and both standard and entity-specific actions.
Why: The triad follows the schema, so a card is the object summarised, a listing is the schema's records, and a detail is one record in full. Because every listing is schema data the controls stay global, and only the actions vary, since those come from the Event nodes attached to that specific entity.
Result becomes measurable output
Business Results become charts, metrics, comparisons, and dashlets.
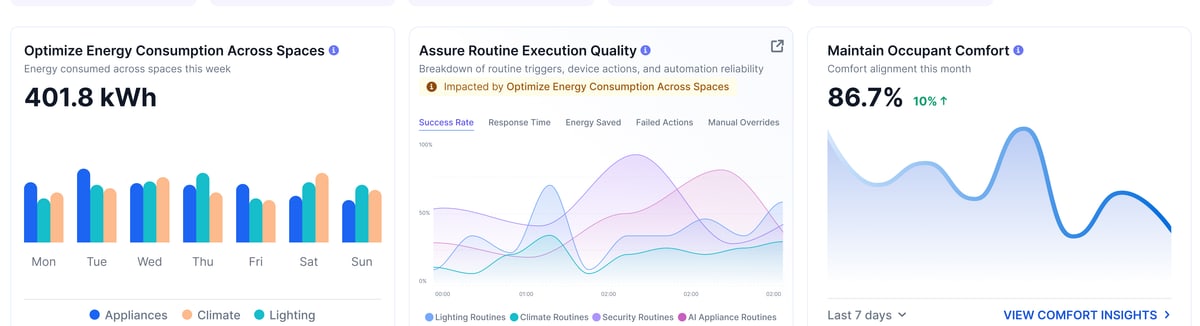
Rule 3 · Business Results as charts and comparisons, one dashlet per result.
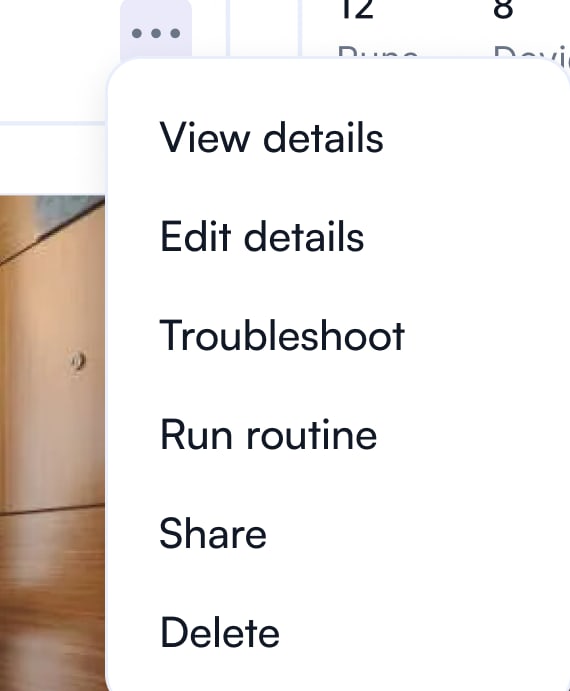
Rule 4 · the actions on this entity, drawn from its Event nodes.
Event becomes action
Event nodes become contextual actions specific to the entity.
Trace becomes feedback and traceability
Business Traces become activity logs, audit trails, and action history.
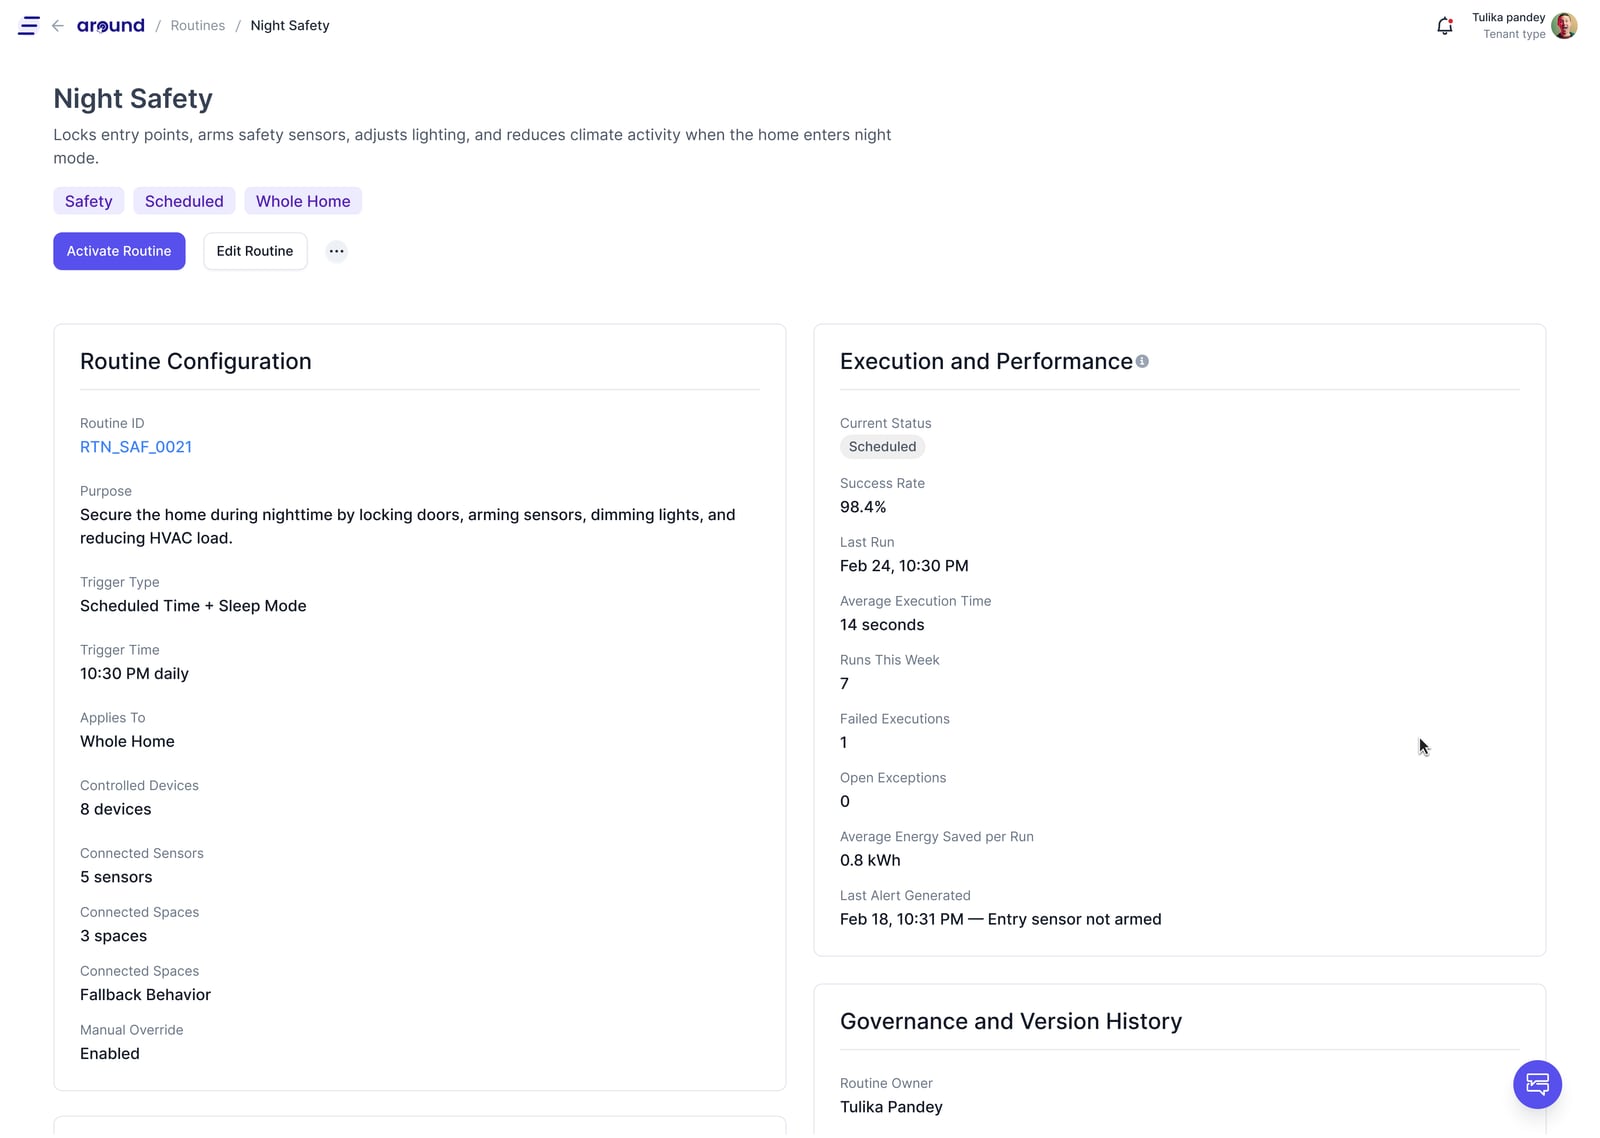
Rule 5 · execution history, success rate, and last run on the entity record.

Rule 6 · the laws the agent operates under, stated at the top of the dashboard.
Law becomes governance
Business Laws govern what users can see and do. The intent dashboard states which laws the agent operates under, so governance is continuously visible rather than surfacing only at the point of refusal.
Why: The rule splits by what the restriction protects. Fields the user has no right to know exist are hidden, and actions they can see but cannot perform are disabled rather than removed, so the restriction stays legible instead of silently changing the interface.
Process becomes workflow
Process nodes become the multi-step sequences an agent runs, across five orchestration types: API, ML, ETL, LLM, and infrastructure.
Why: Operators get a pipeline view of the sequence; builders get the same sequence as an editable workflow.
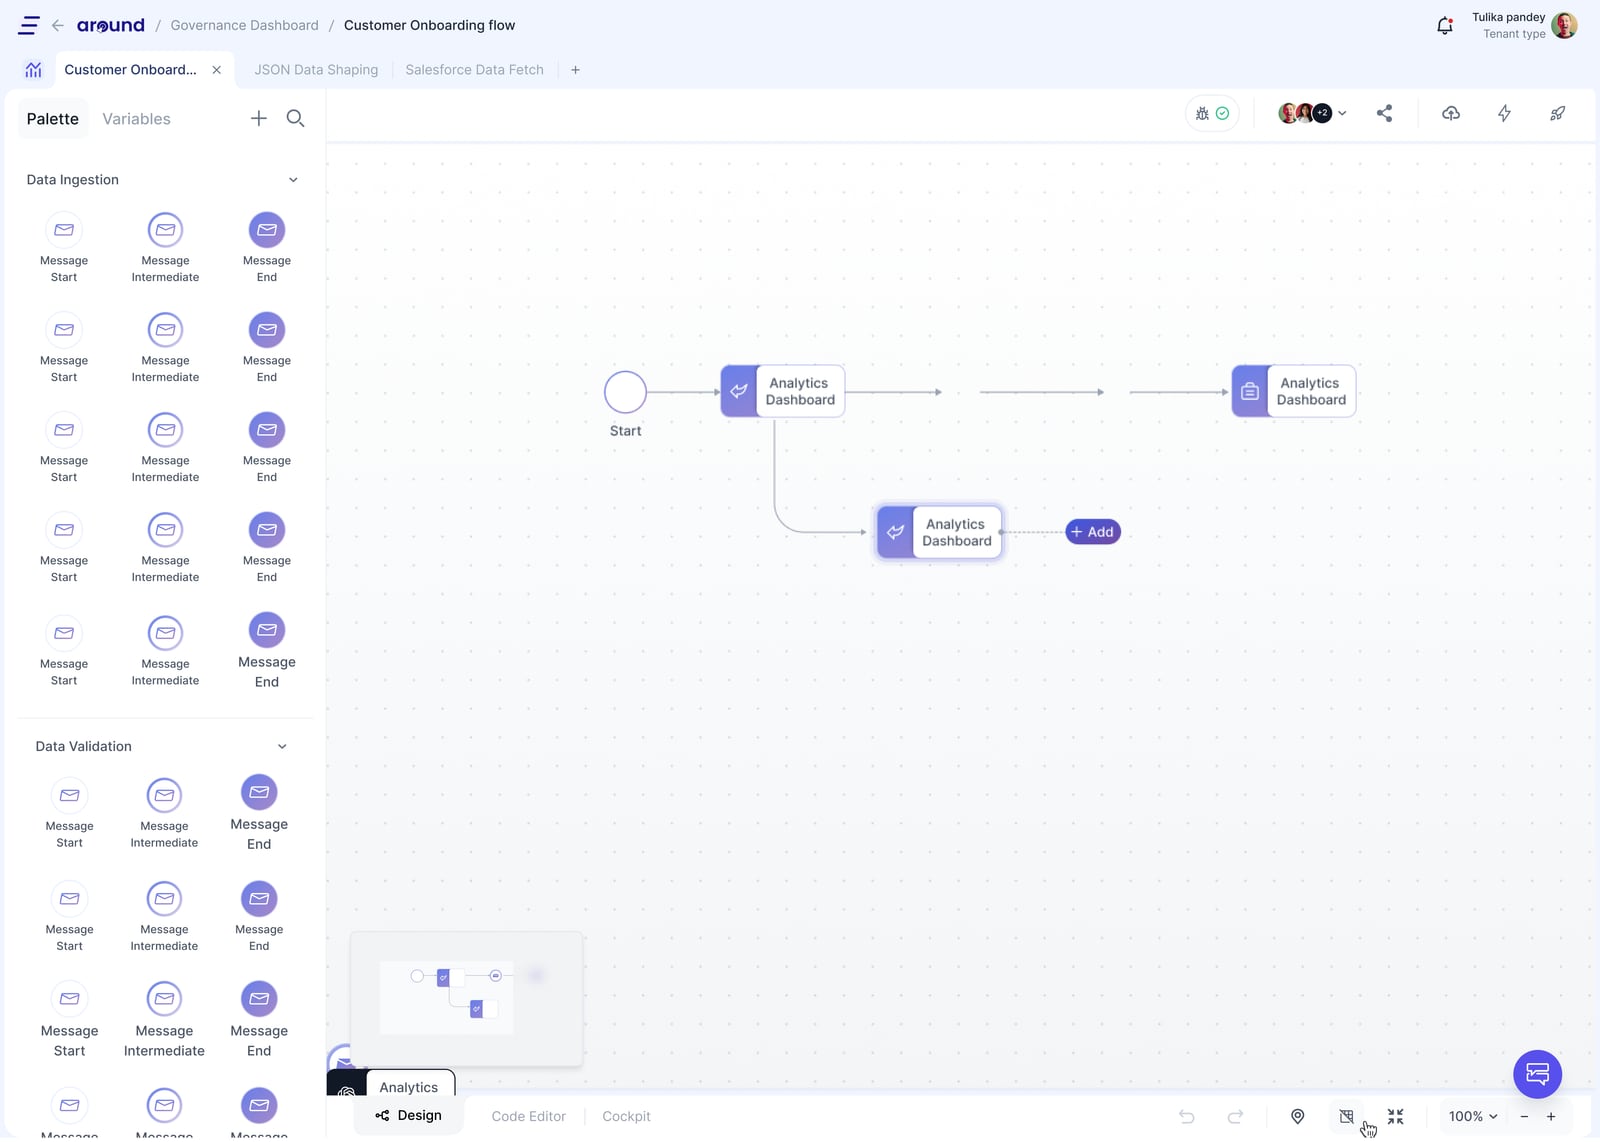
Rule 7 · the process as an editable sequence, with the step palette on the left.
The conversation surface
Alongside the seven rules, every agent interface carries a conversation window. It is part of the pattern rather than a per-agent decision: the same docked window on the dashboard, the same full screen and split views, in the same place on every agent. Natural language is how people expect to work with an agent, so the pattern guarantees the surface is there and consistent.
What the conversation can actually do is not the pattern's to define. That follows from the agent's reasoning features and its graph definition, owned by the teams building them. The pattern places the surface; the agent determines its range.
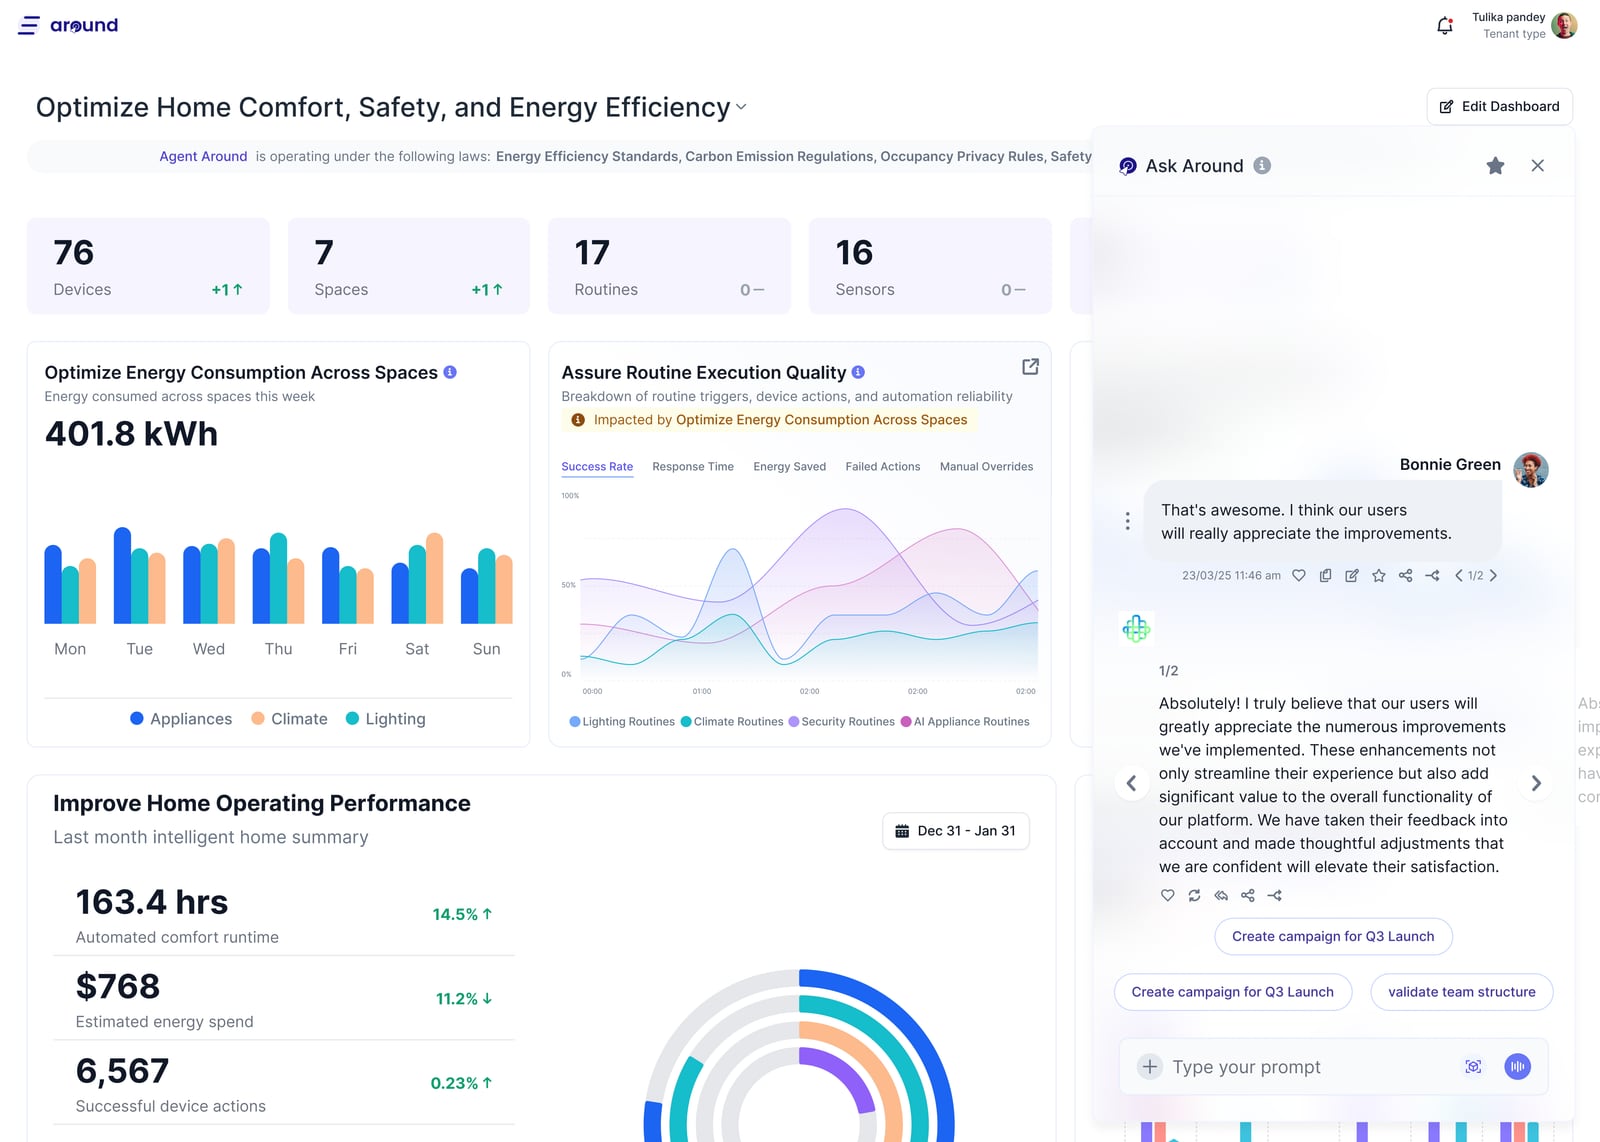
Docked window
Docked beside the graph-derived dashboard
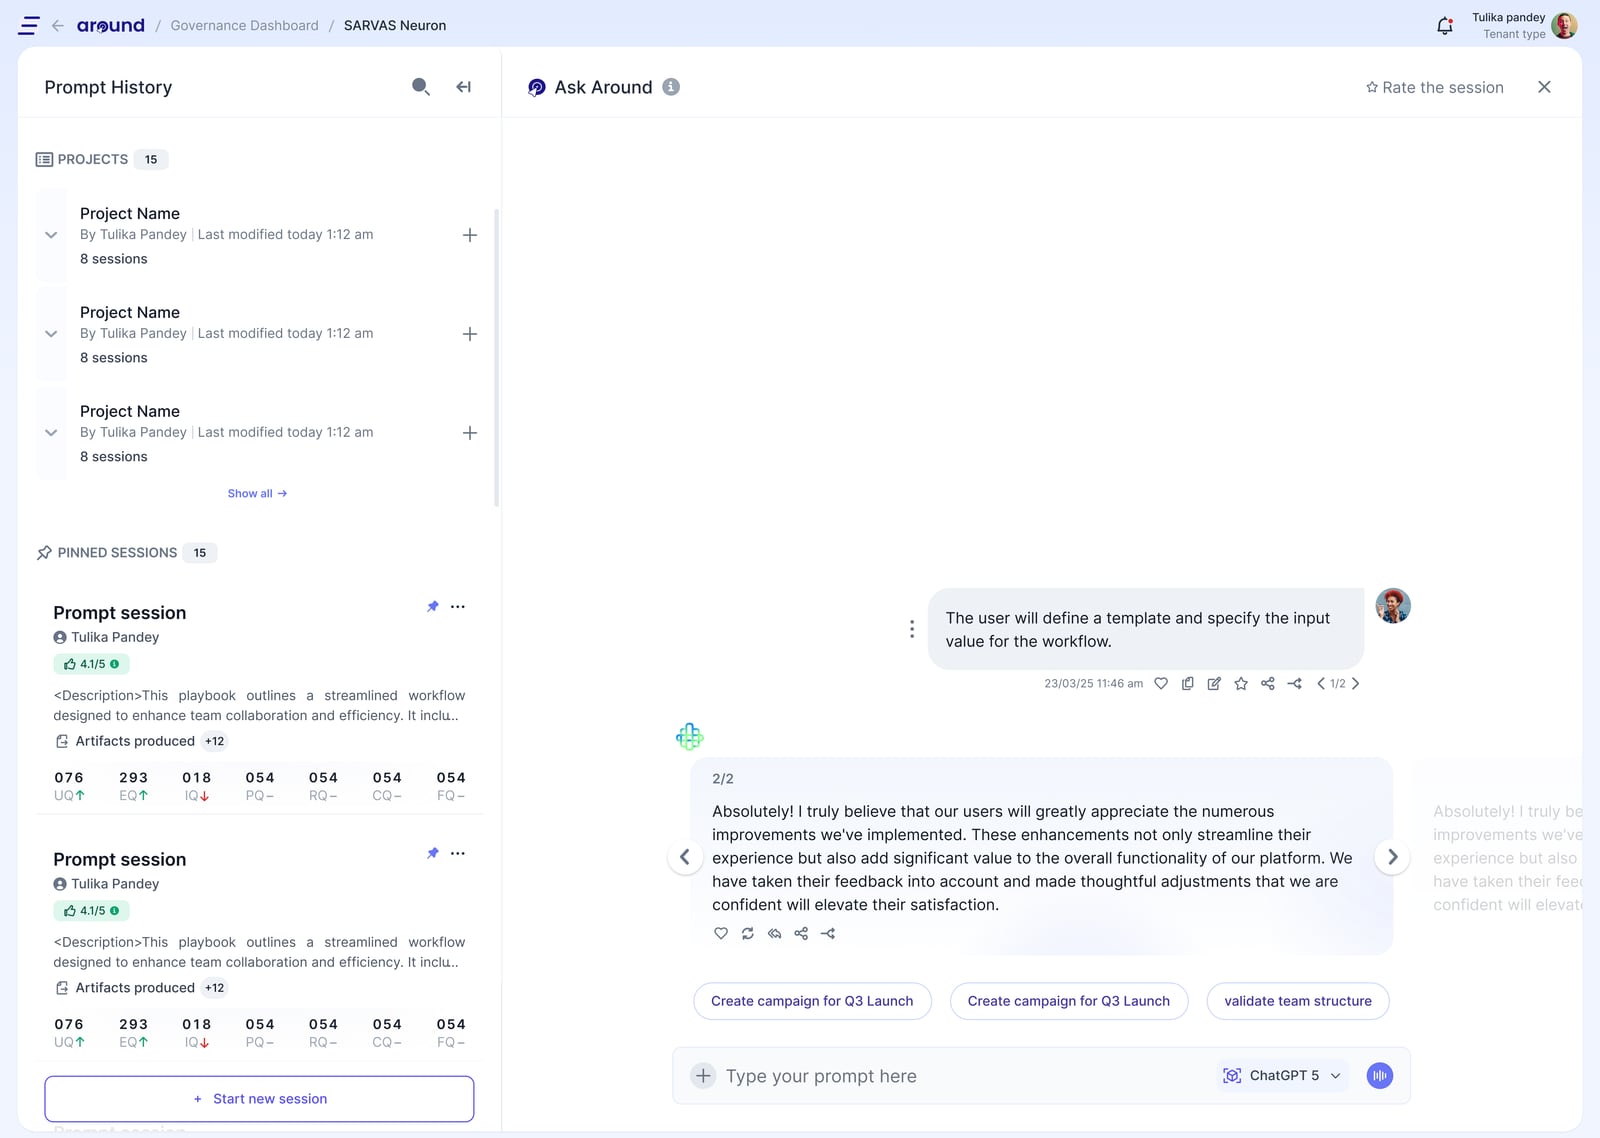
Full screen, single view
Session history and prompt in full screen
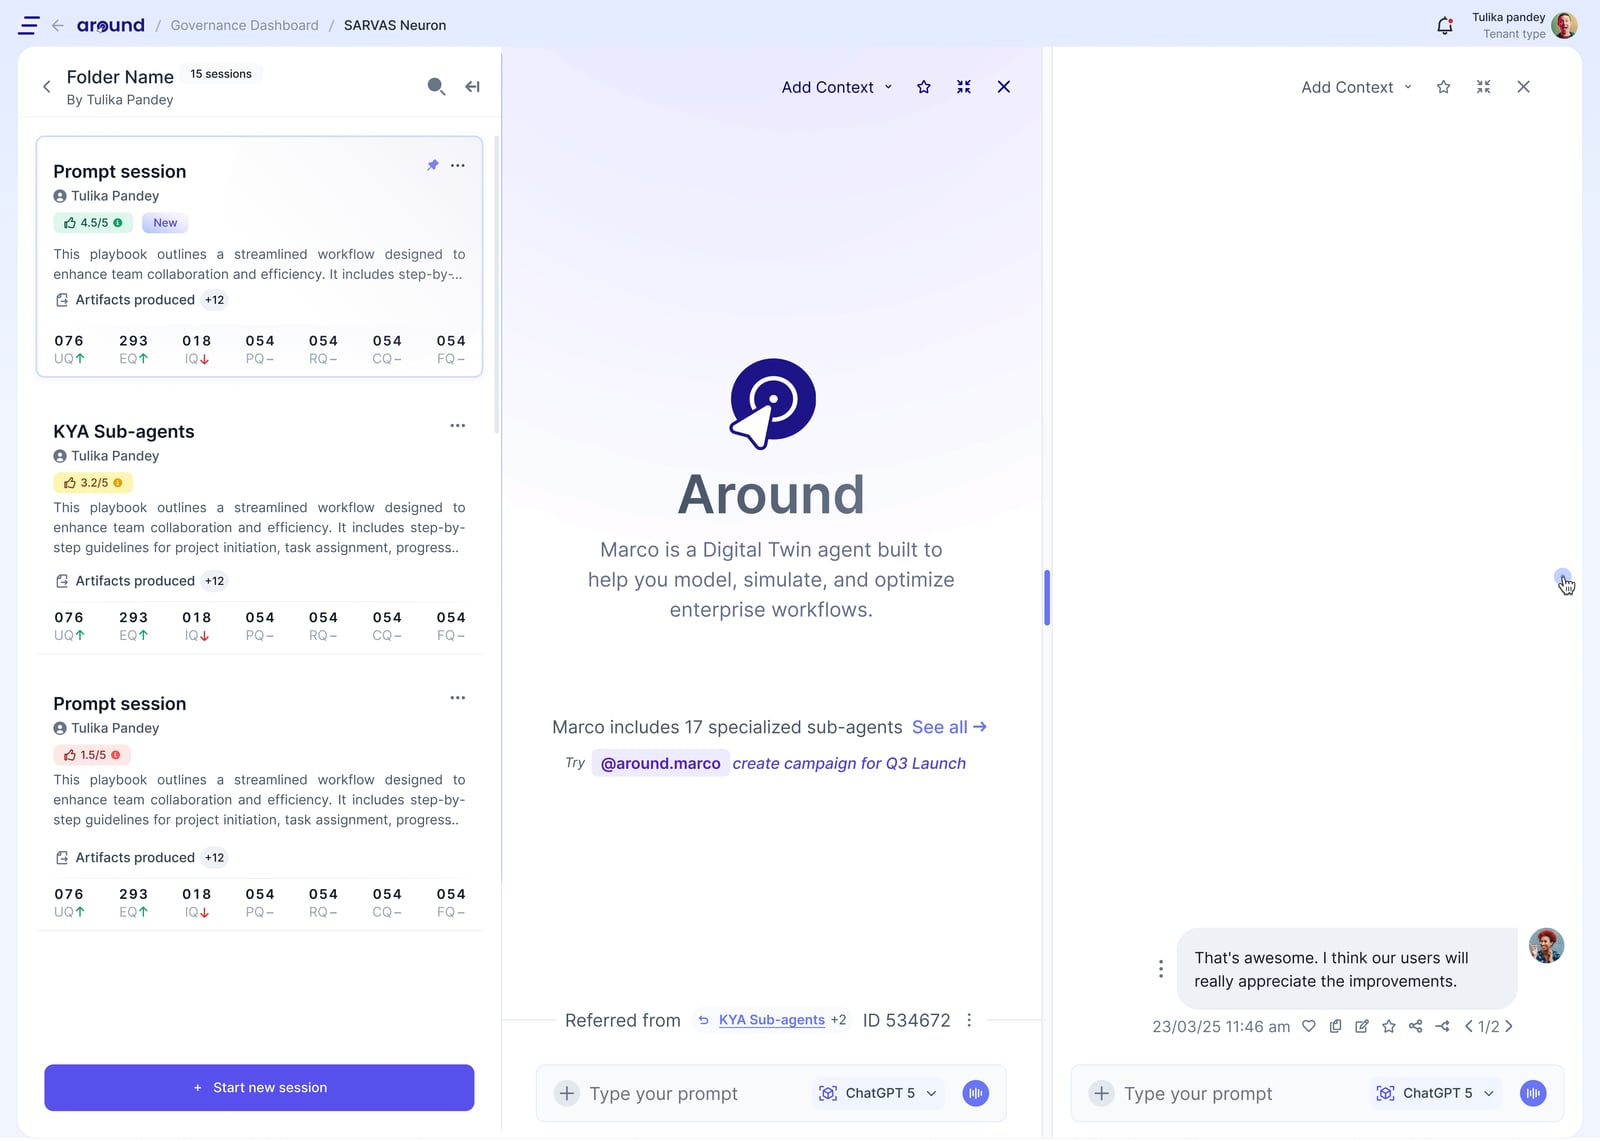
Full screen, split view
Two sessions side by side
Iterations
A conversation anchored to the whole dashboard can only answer in general terms. These iterations moved the interaction down to the widget, so a question inherits the object it was asked from and the answer comes back scoped to it.
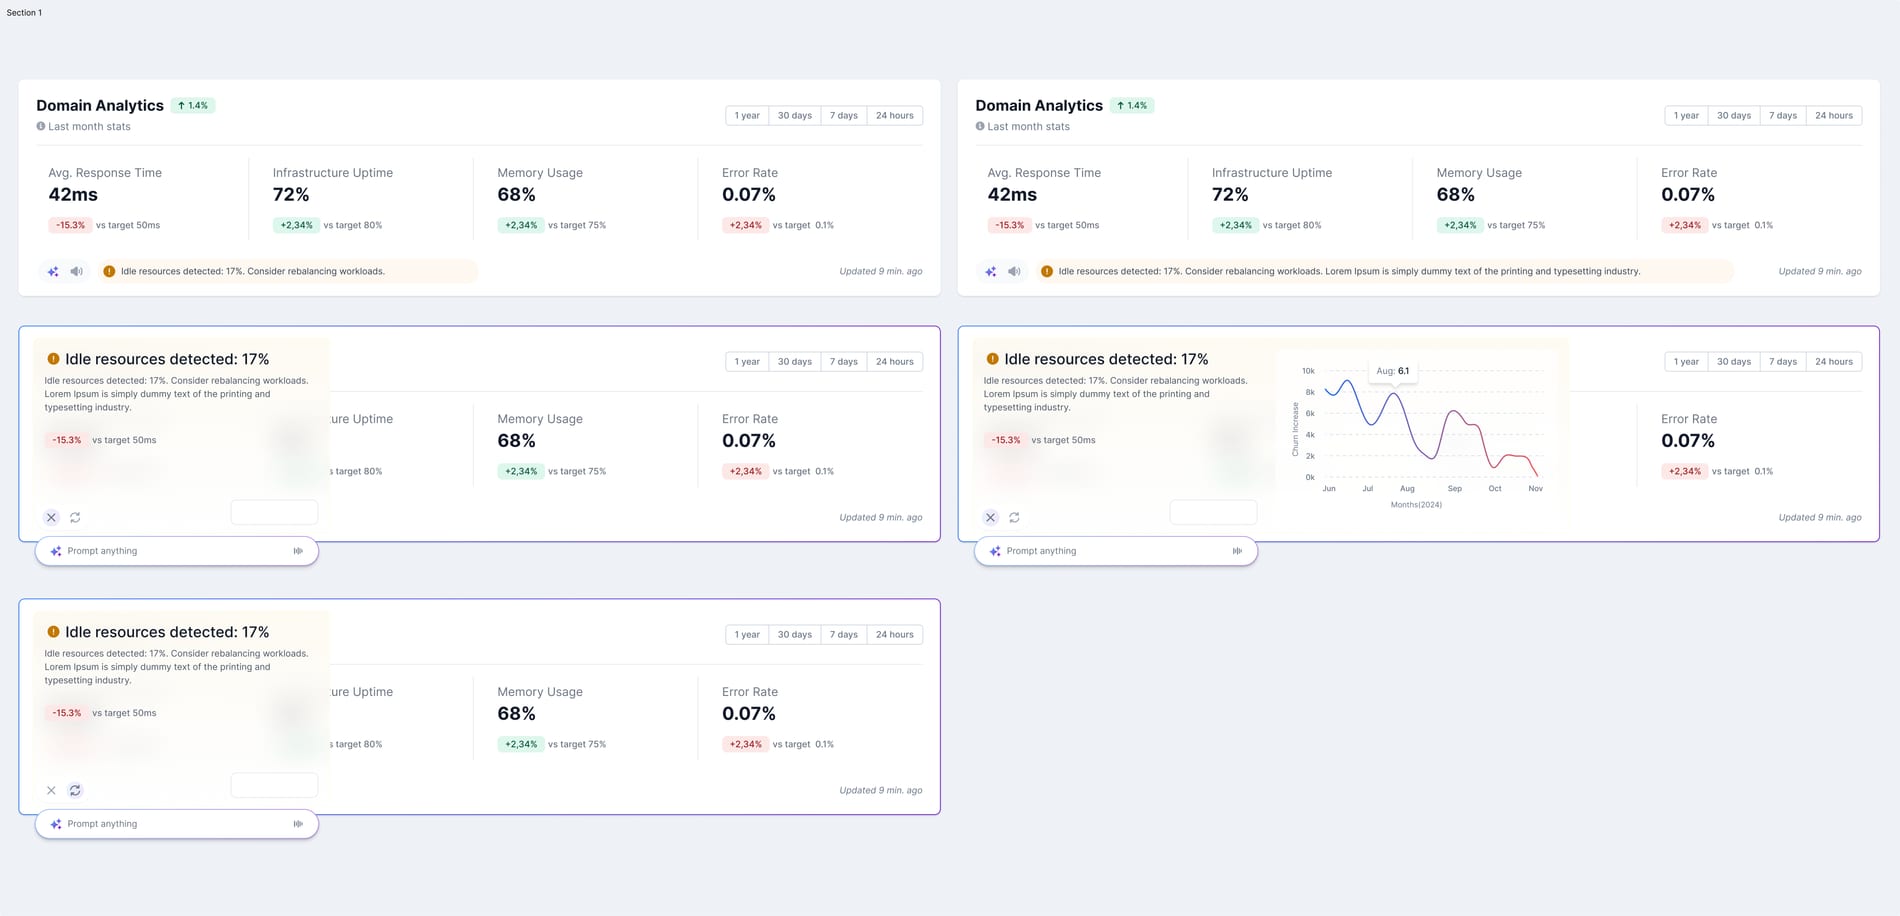
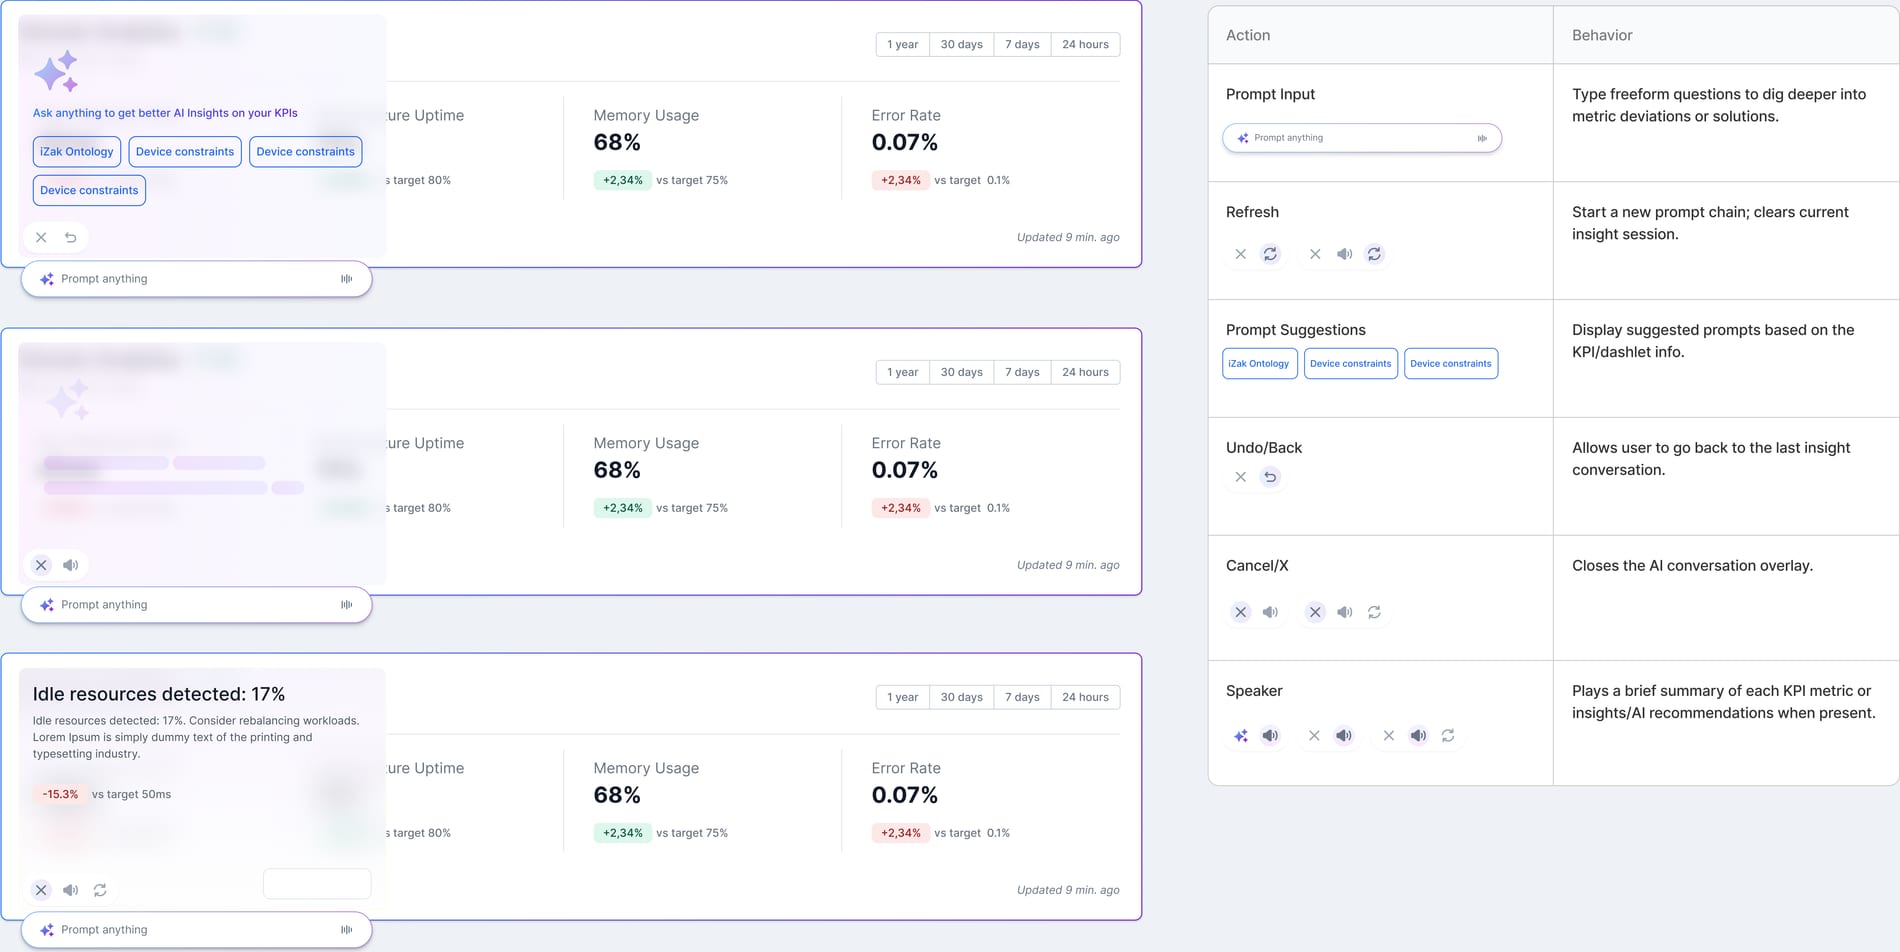
Two experiences, one graph.
The same graph produces two experiences. Operators use the agent without seeing the graph. Builders work directly with the graph.
Operator
- Operators never see the graph
- They see dashboards, objects, actions, charts, and traces, in the same order on every agent
- The flow is the same on every agent, by design
- Governance is still visible: operating laws on the dashboard, governance and version history on the entity
Intent dashboard
The entry point for both journeys. One tab per Business Intent, the operating laws stated across the top, then entity counts, result dashlets, and exception summaries, all composed from node types.
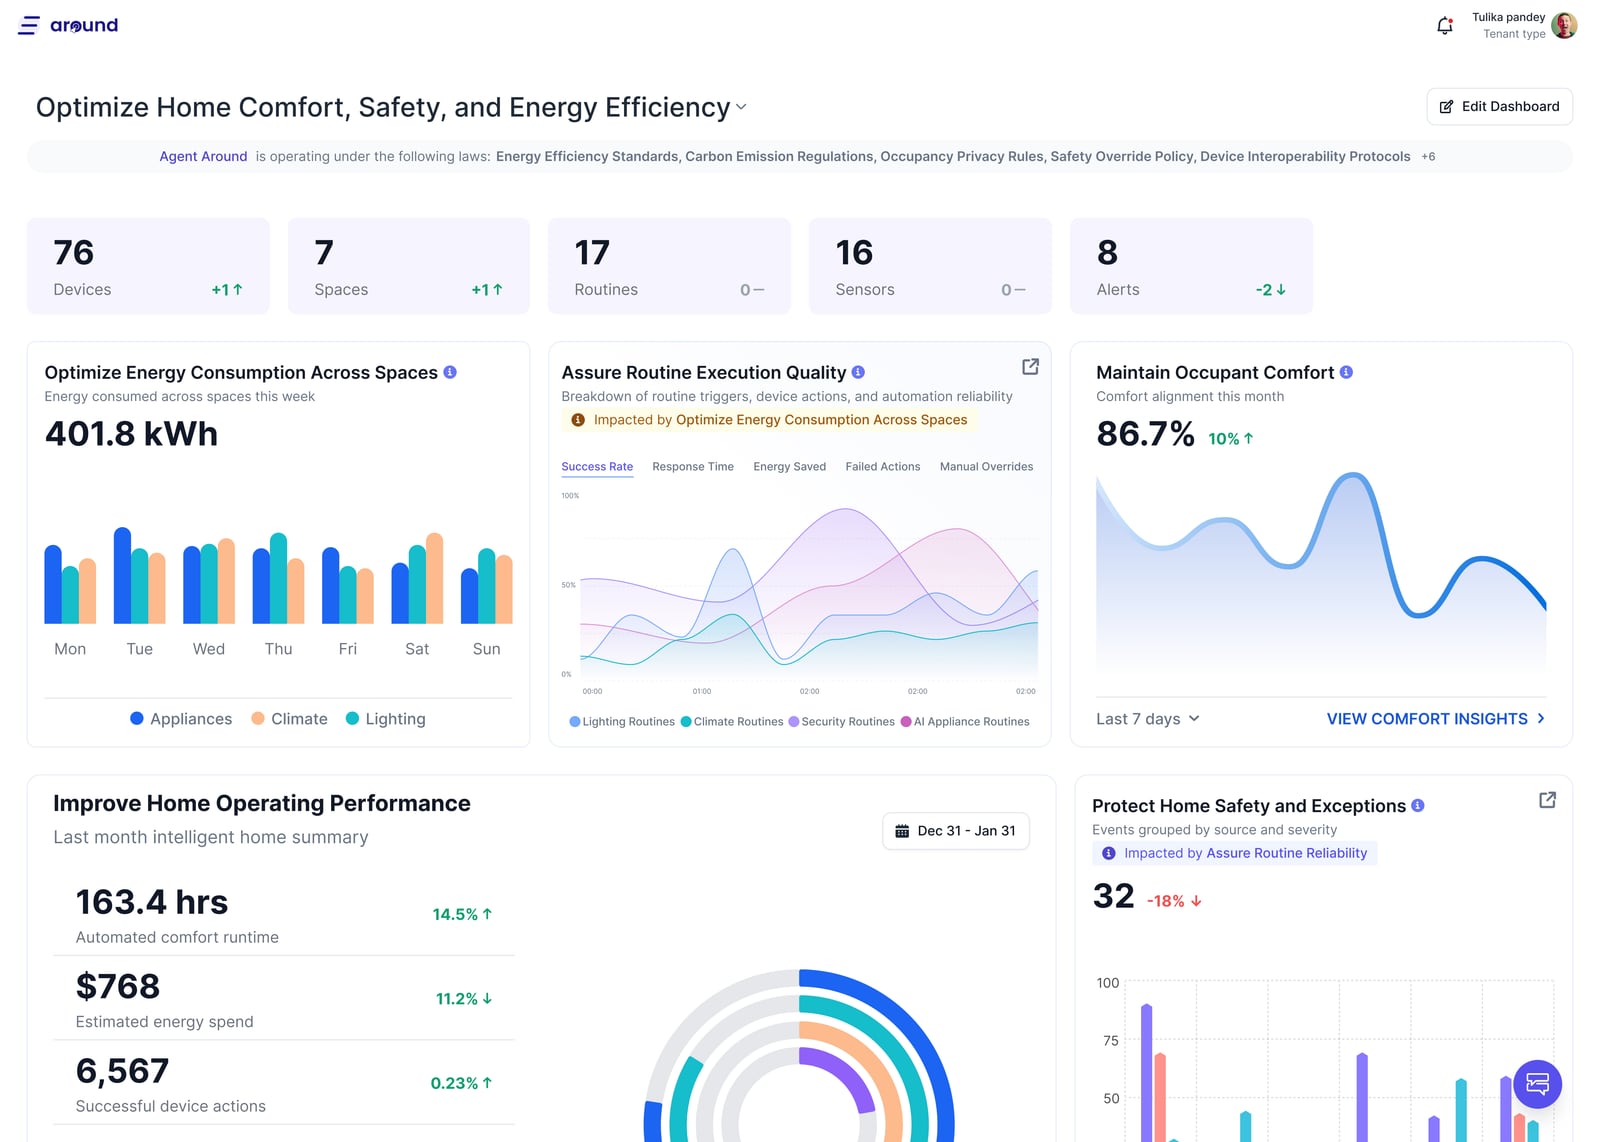
Entity listing, cards
The schema’s records. Status, counts, and imagery come from schema attributes, which is what decides the card variant.
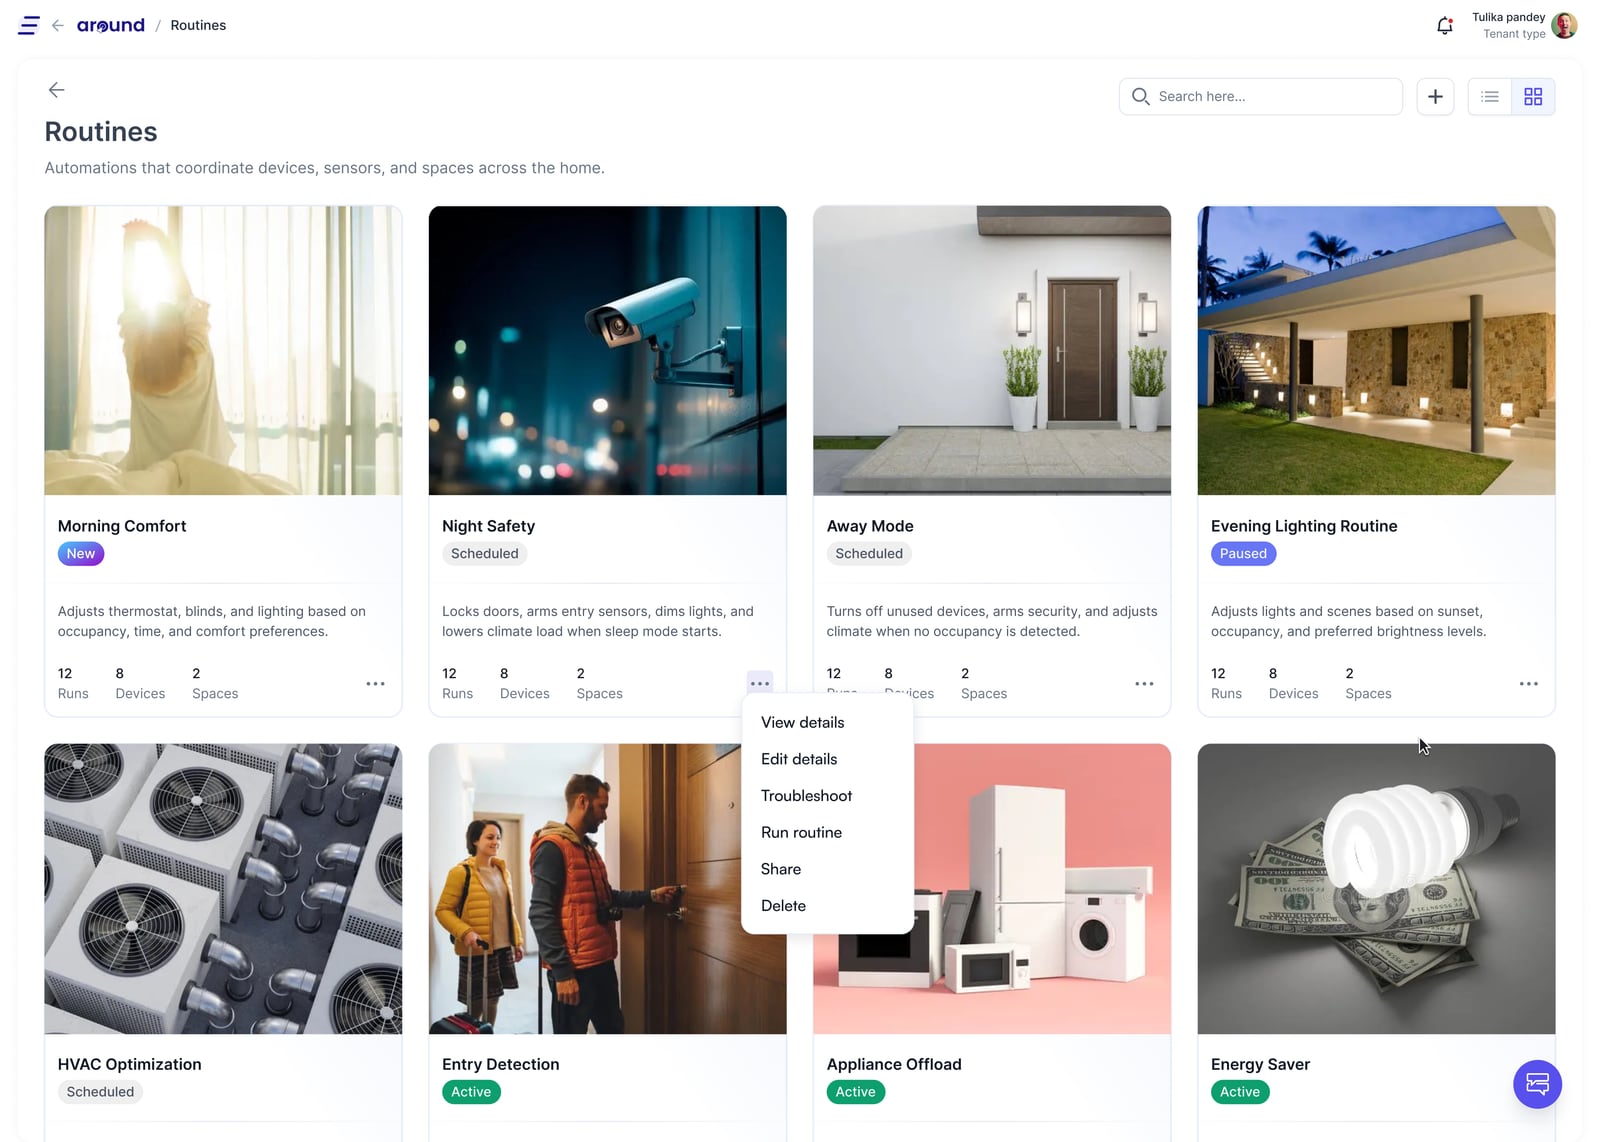
Entity listing, table
The same records in the table variant. The toggle, search, filter, and sort are identical on every agent because every listing is schema data.
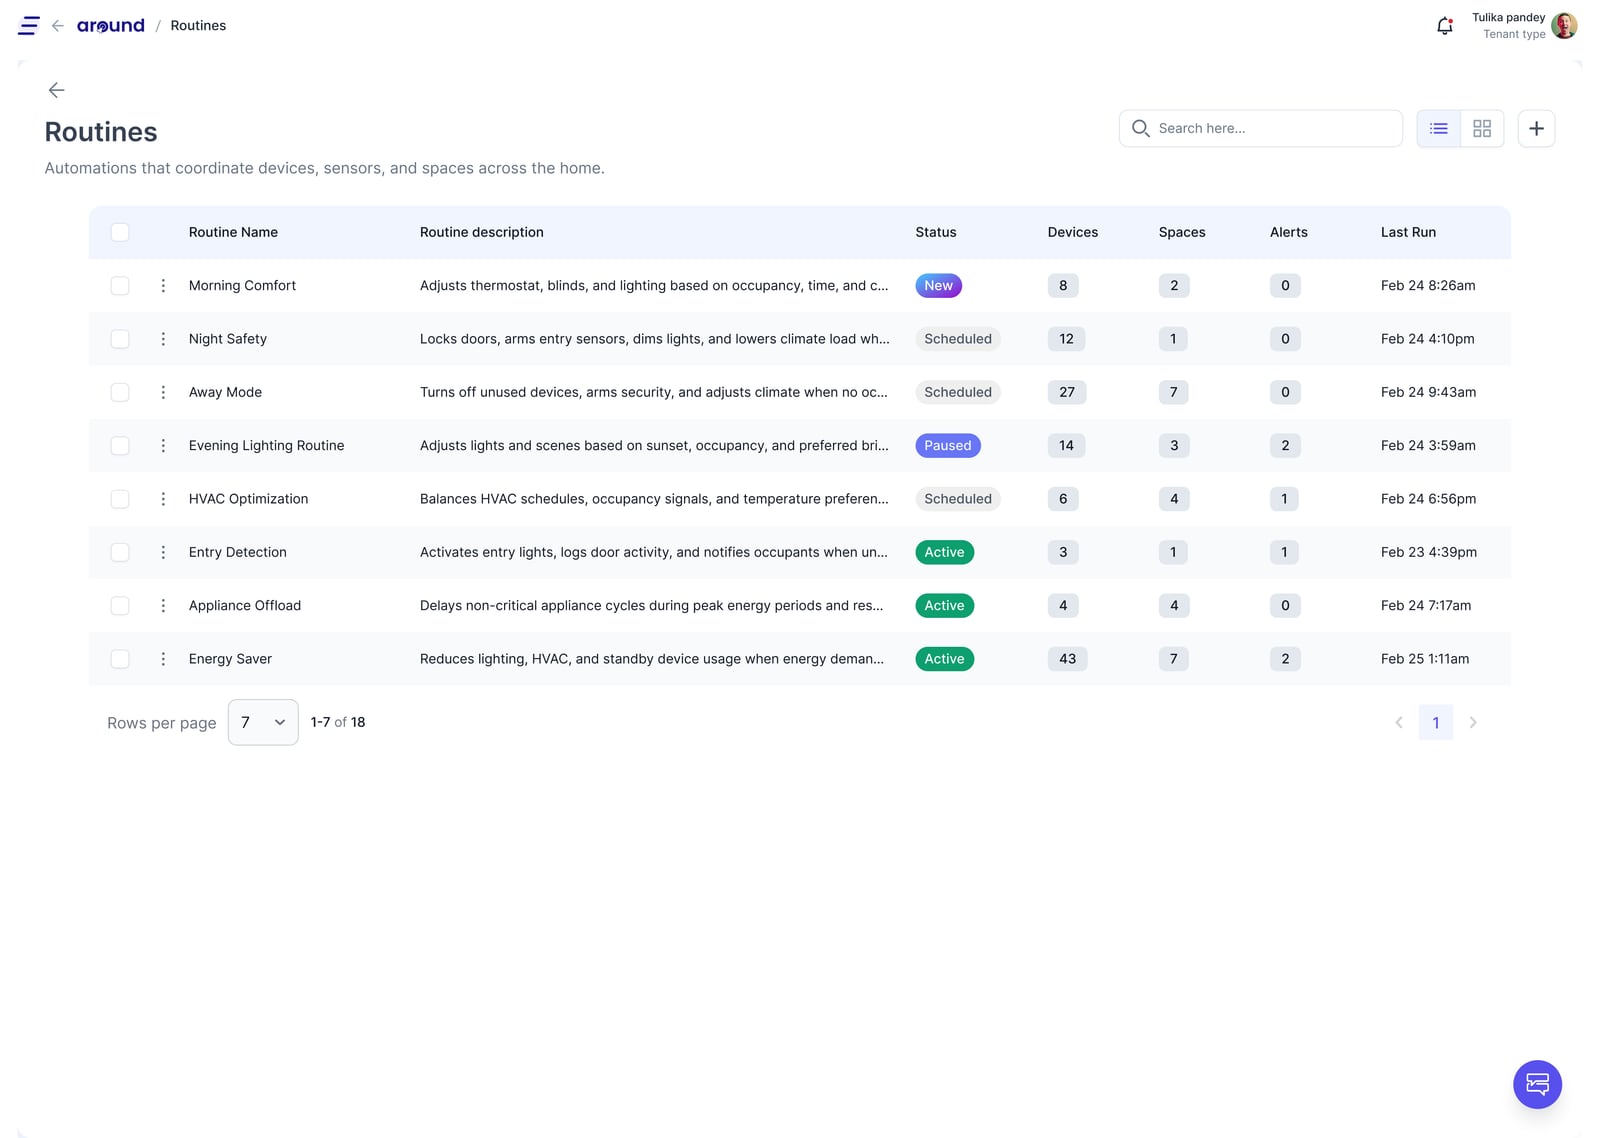
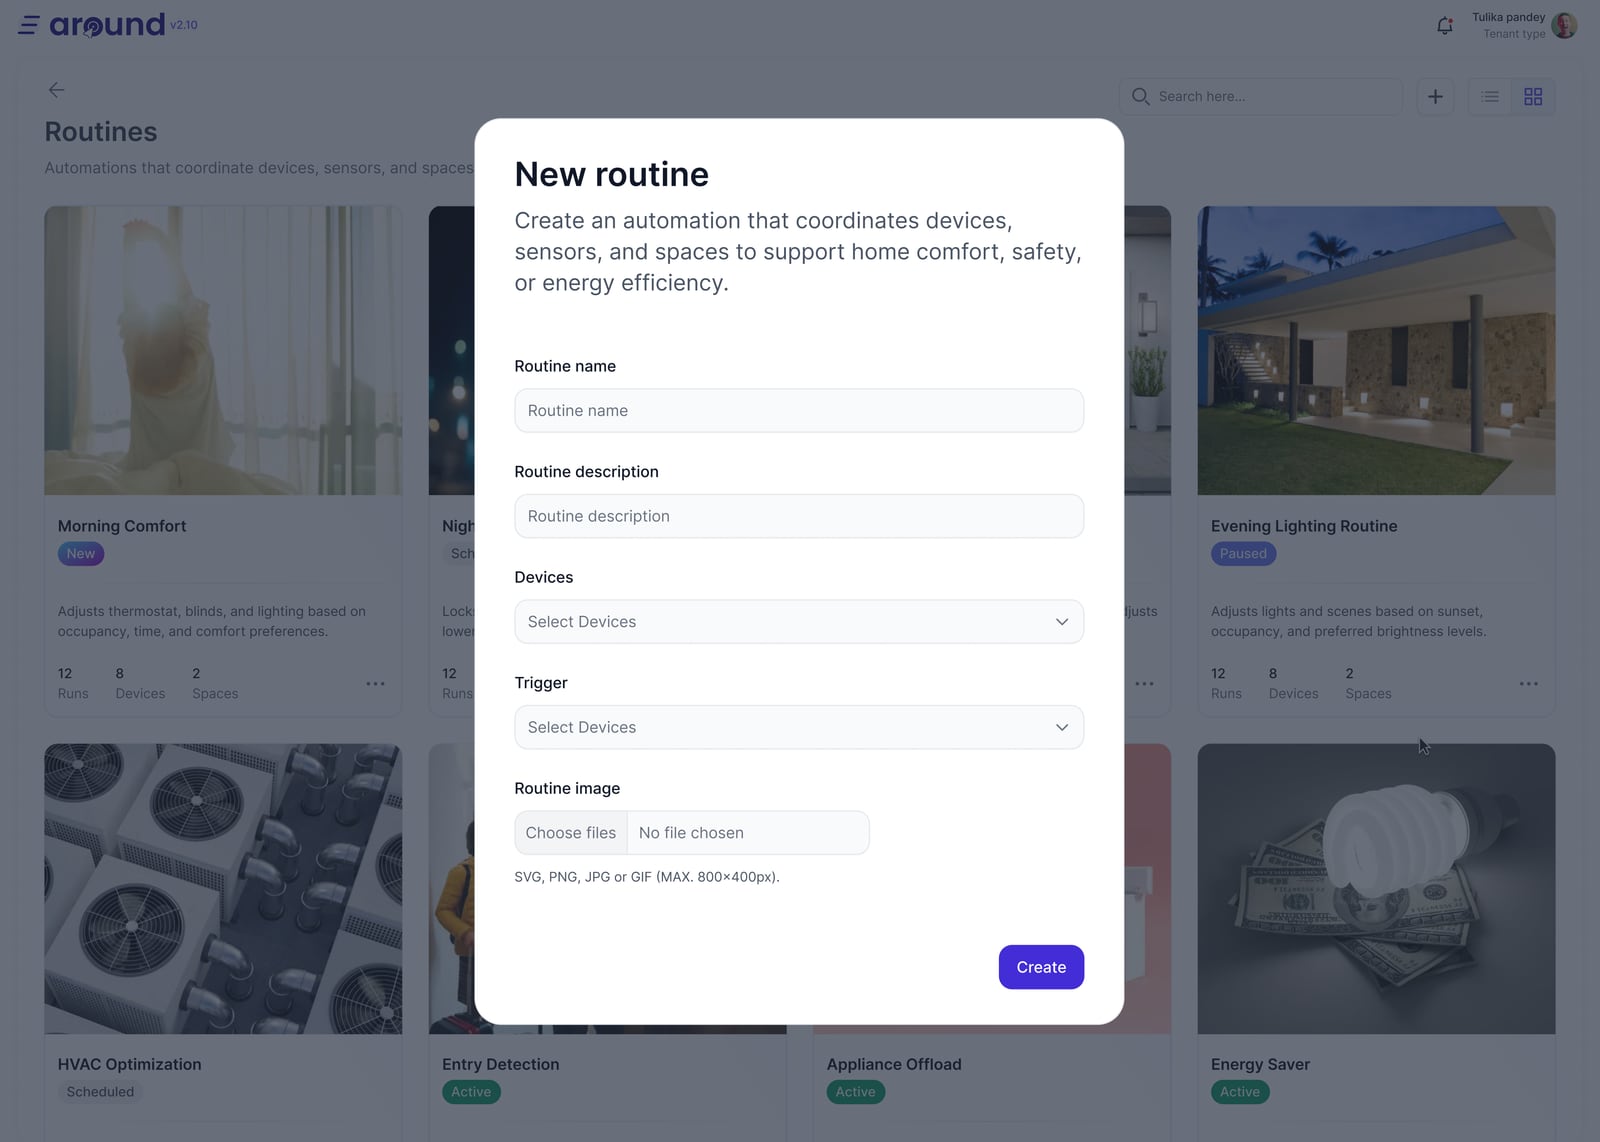
Create entity
Rule 2 in reverse: the form is generated from the same schema that renders the listing, so the fields and the columns cannot drift apart.
Entity detail
One record in full. Configuration on the left, execution and performance on the right, governance and version history below. The operator never sees the graph, but does see what the agent did and under whose authority.
Builder
Builders needed the opposite contract. Operators use the agent; builders shape it. They enter through the same dashboard as operators, then move into the graph. The builder experience exposes the graph structure so agent owners can manage intents, laws, results, processes, workflows, schemas, and executable artifacts. The graph becomes a product surface, and governance is part of the product model.
The graph canvas and the artifact management canvas both carry governance, and neither composes from the pattern. Both were built on Flowbite rather than from scratch, which kept the effort on the graph-to-interface mapping.
The recurring question from product owners was some version of “how do I find this” or “how do I configure this”, where this was their own business object. The pattern was legible in the abstract but not against their specific case until they saw two examples resolve end to end. After that the question stopped being asked.
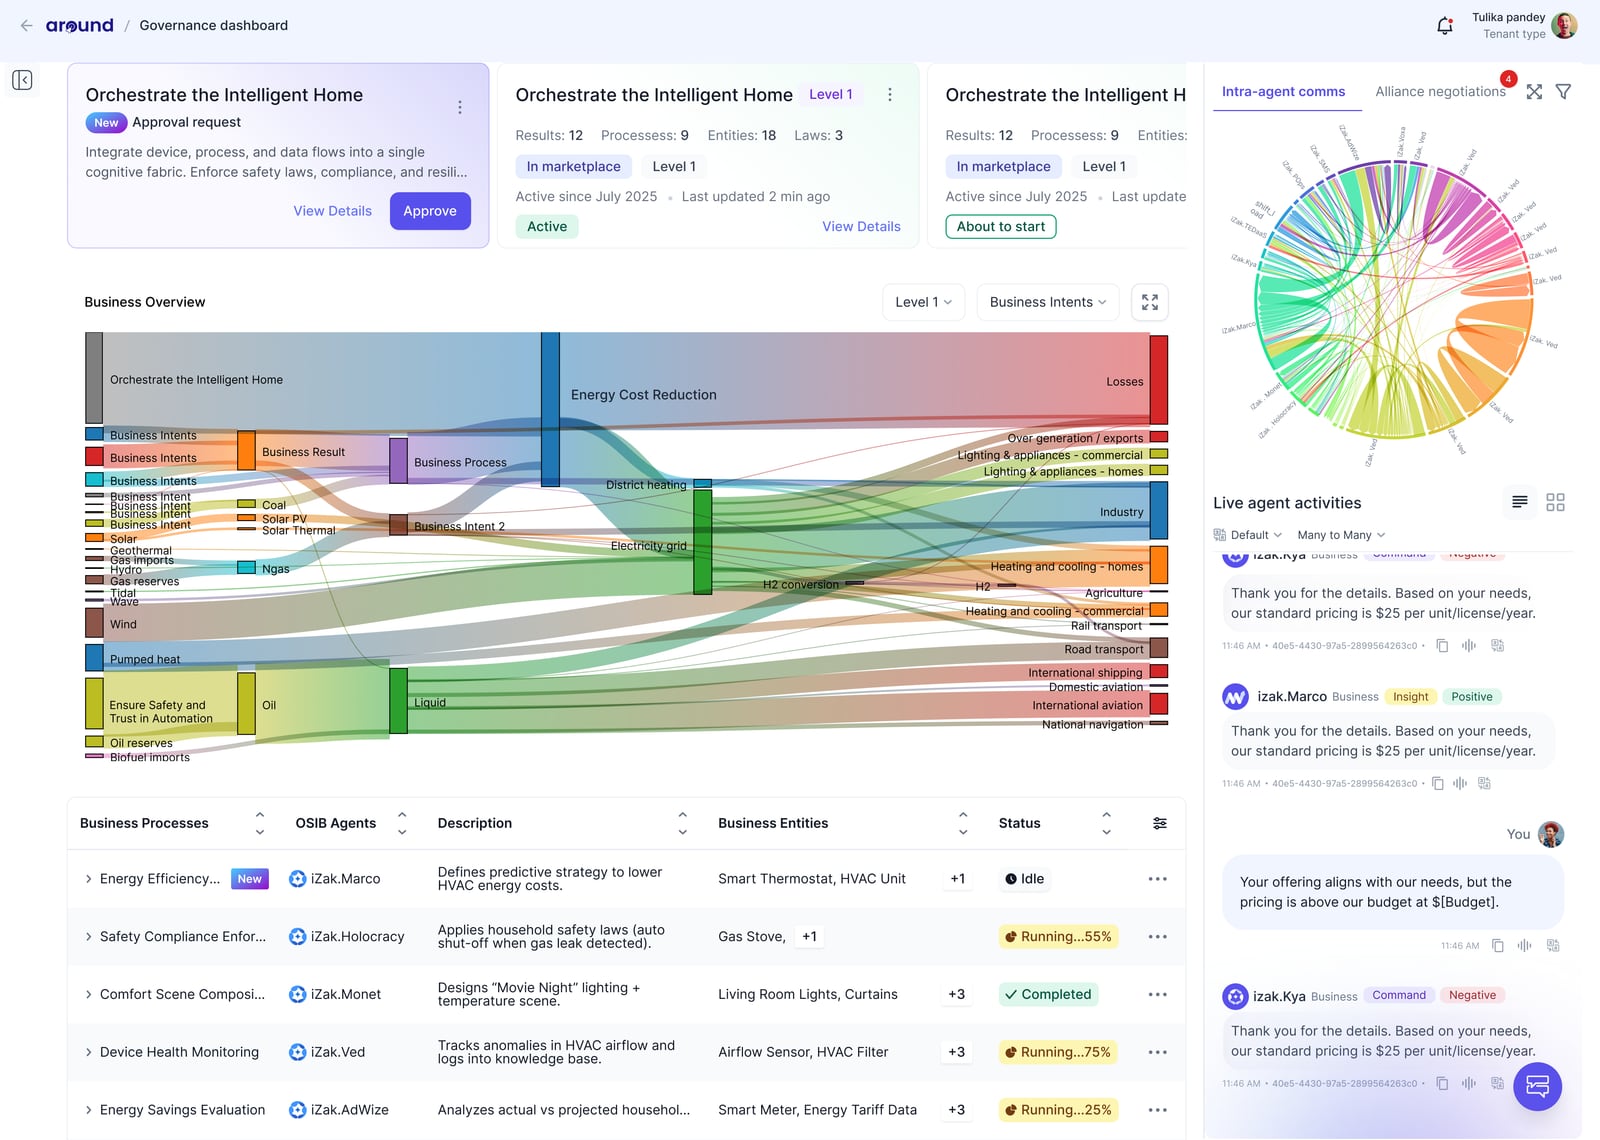
Governance dashboard
The agent’s whole operating picture: intents, results, processes and laws counted per agent, the business overview flow, and live agent activity in one place.
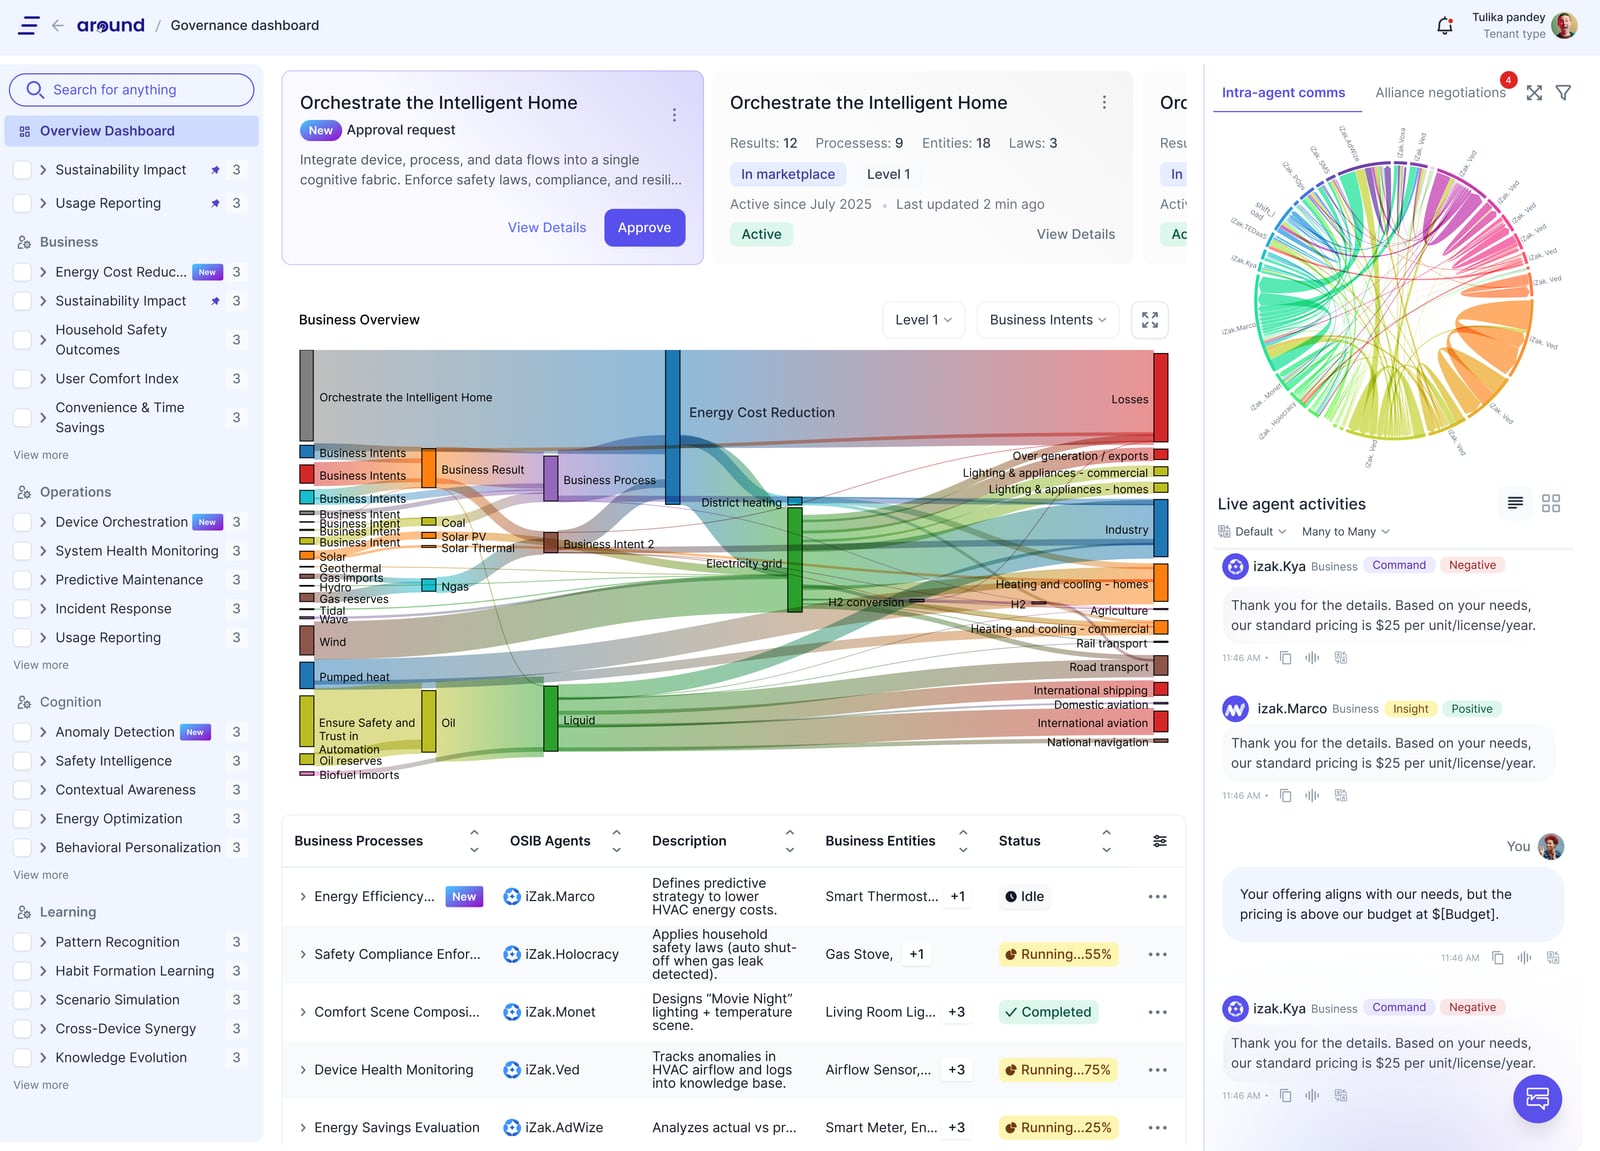
Governance dashboard, navigation open
The same view with the tree expanded, showing how business, operations, cognition, and learning are organised.
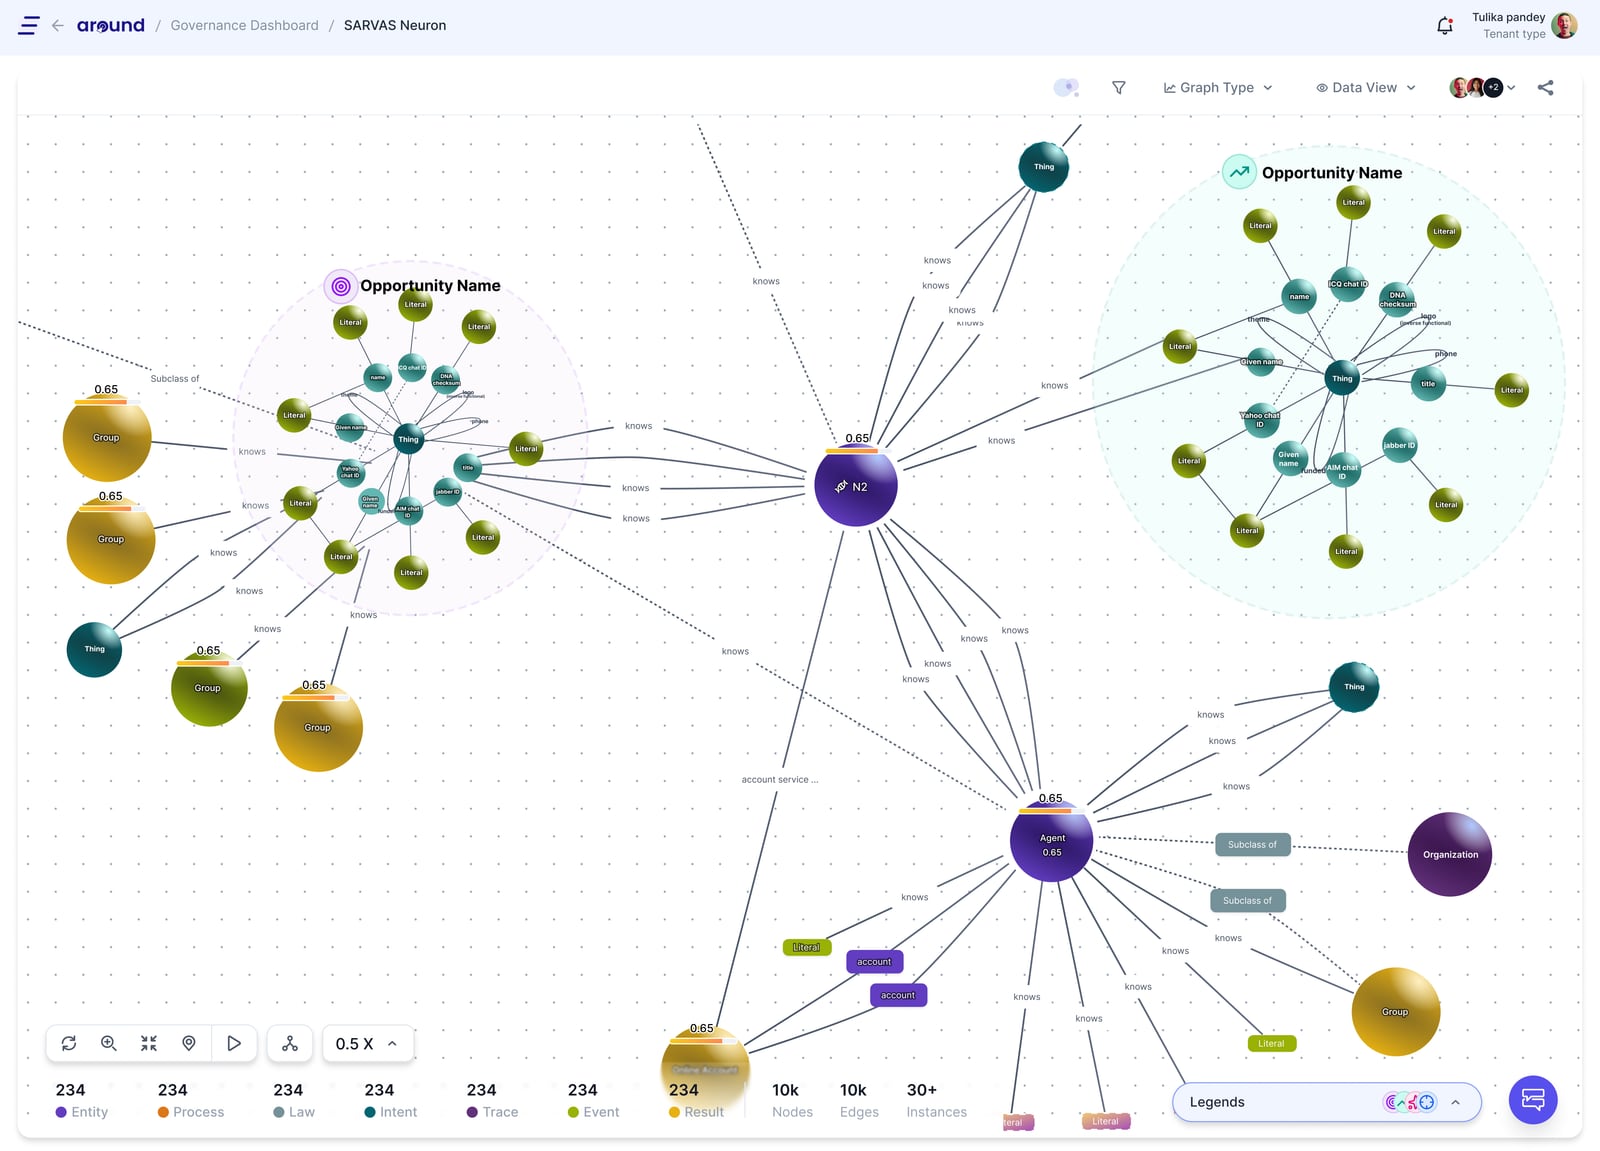
Graph view
The graph as a working surface. The counters along the bottom are the seven node types the grammar is built on, read straight from the agent.
Workflow config
Rule 7 in edit mode. The step palette on the left, the sequence on the canvas.
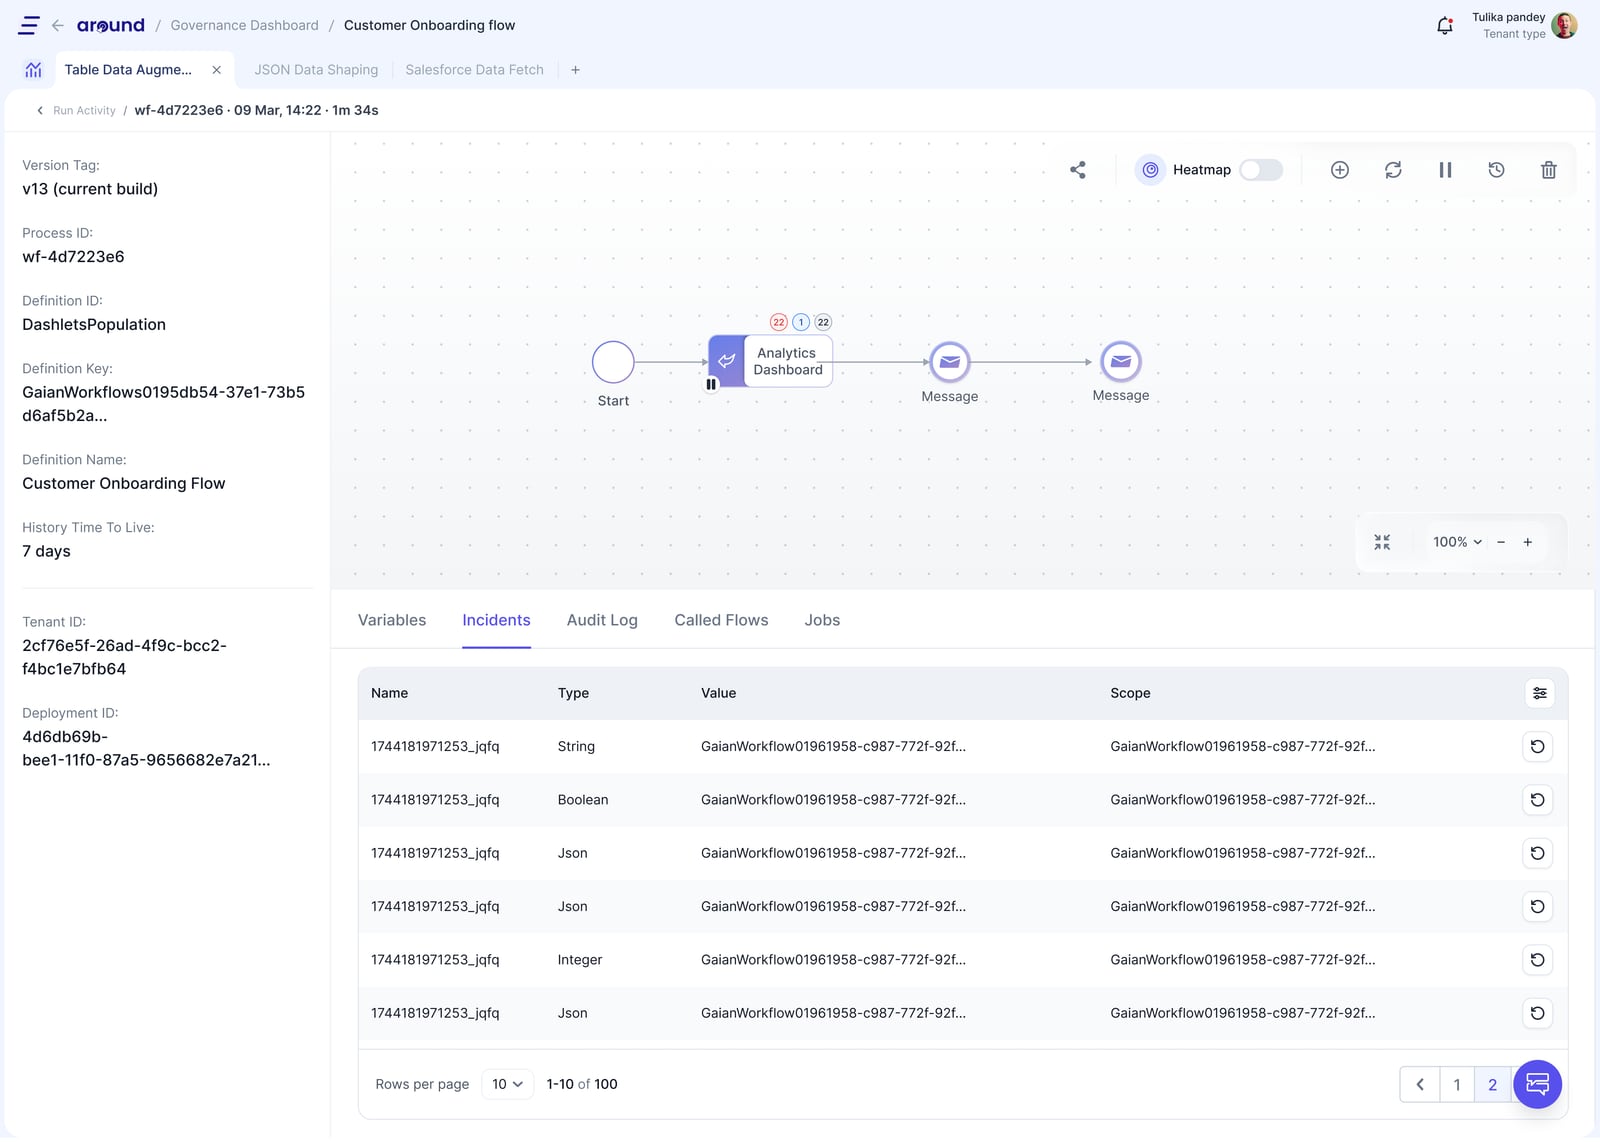
Workflow run detail
A single run: version, definition, variables, incidents, audit log, and called flows.
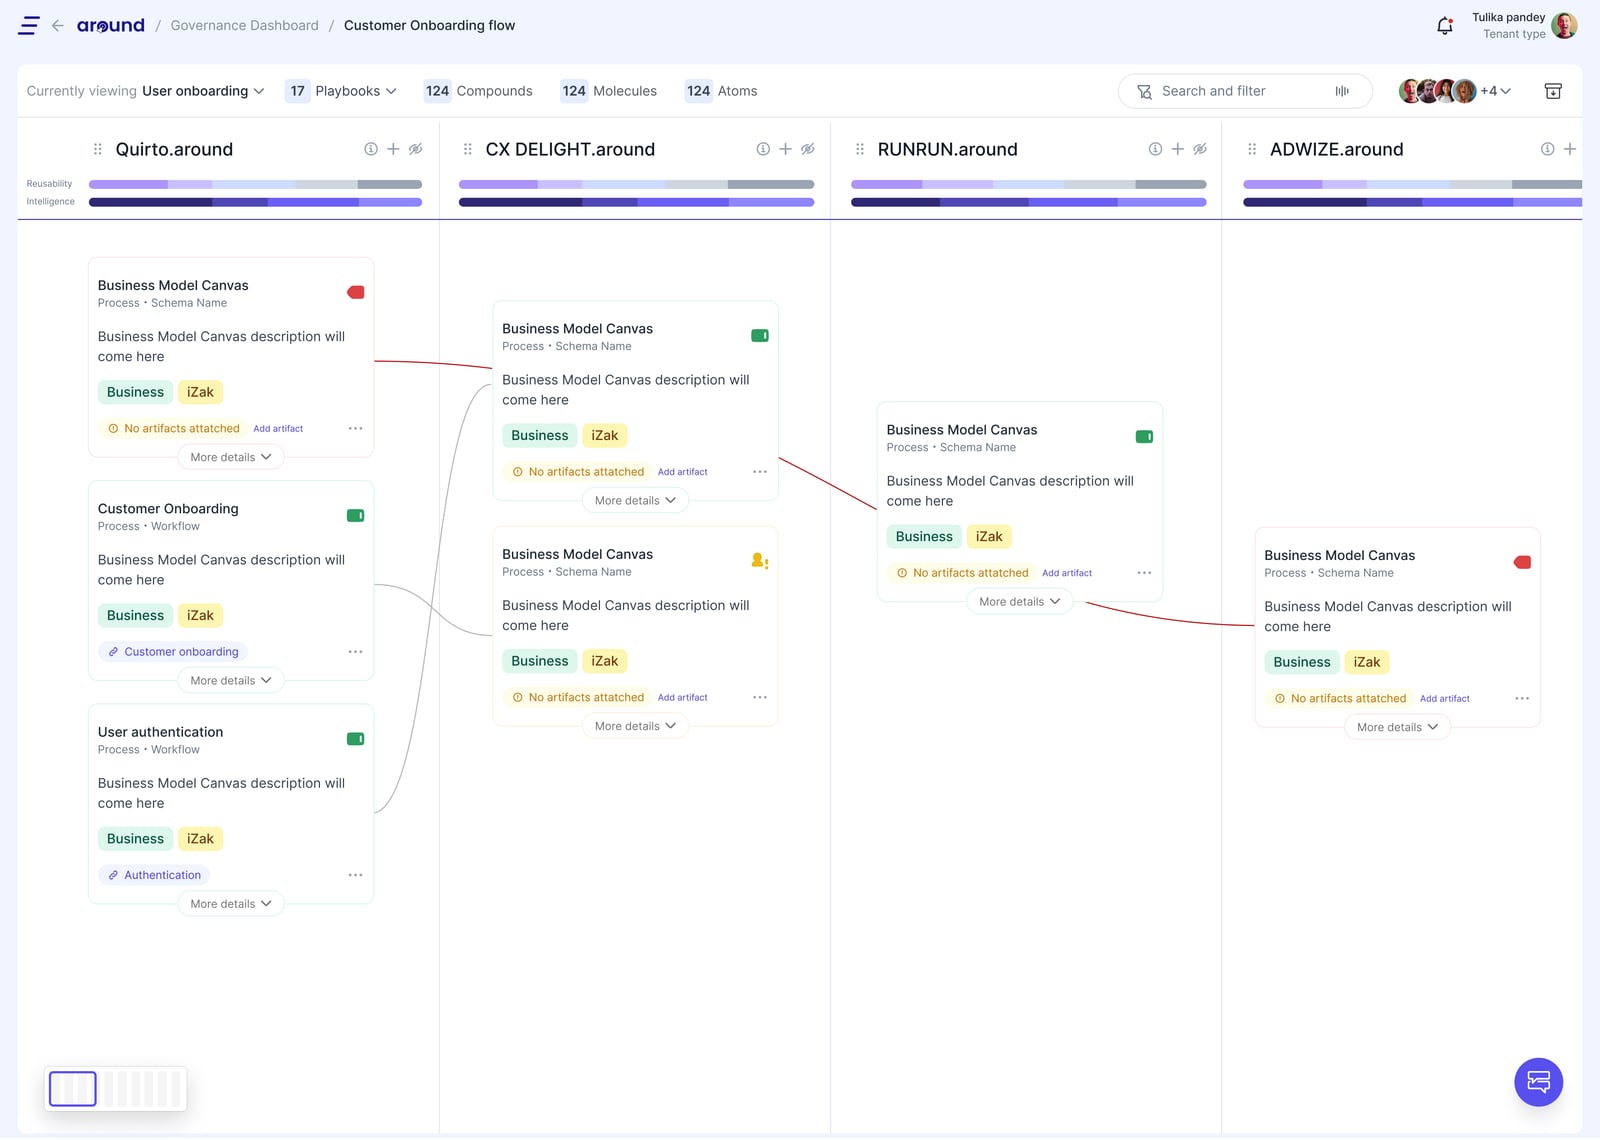
Artifact manager
Reusable artifacts across agents, from playbooks down to atoms, with reusability and intelligence scored per agent.
Coverage, limits, and proof.
The pattern covers journeys built from dashboards, listings, details, actions, charts, and traces. Those compose from the graph reliably.
Coverage
The pattern expresses about 80% of agent journeys. It breaks in one specific place: canvas screens. A marketing agent is the clearest case, where campaign creation is canvas-based pipeline building and does not resolve from the graph.
One limit was known before rollout and still stands: canvas-based agents. A CMS DITA agent needs a document canvas, and a low-code UX builder needs an editing canvas. The canvas is the one component that does not compose from the graph, so it is built manually per agent while the rest of the interface still follows the pattern.
Graph canvas
The graph canvas, built manually on Flowbite.
Artifact manager
Artifact management, the second governance canvas.
One rule, two graphs
Rule 2 resolved against two different agents. The structure and controls are identical because both listings are schema data; only the records and the entity-specific actions change.
The delivery claim, substantiated
Before: one agent interface took 3 to 8 weeks of design and 1 to 3 months of development, scaling with the complexity of the app and the size of the team. After: the pattern is built once, and each new agent's interface follows from its source graph plus basic deployment, which brings baseline setup to about a day.
Adoption
4 agents are live on the pattern and more than 40 are in the pipeline, with clients waiting on deployment. It was rolled out to the other product owners building their own agents, who apply it themselves from a Confluence doc covering how the pattern works.
UX as product infrastructure.
Strategy
Because the graph-to-interface mapping is explicit, interface generation is repeatable, and a repeatable mapping can be executed by something other than a designer. Training a UX agent on the pattern is a stated intent for the framework, not a side effect: the rules, the node types, and the conditional checks on schema attributes are the training structure.
What I would do next
This was framework work. Every agent currently renders in the same UI and only the content changes, which is correct for proving the mapping and insufficient as a product. The next work is visual language and theming: giving agents distinct identities without breaking the structure that makes them learnable. After that, automating generation, since the mapping is already explicit enough to be executed rather than applied by hand.
What this taught me
The pattern was not adopted because it was documented. It was adopted when product owners saw it resolve against two graphs that were not mine. Designing something other people apply without me in the room turned out to be less about writing the rules well and more about making the rules visible on someone else's object, in their domain, with their vocabulary. The other thing I would carry forward is that knowing the limit early was worth more than closing it. The canvas case was clear before rollout, and naming it kept the pattern credible everywhere it did work.